
Profiler not attaching
Symptom
You clicked Start Profiling and exercised your application, but the Runtime Profiler stays empty — no executions, no rows — or only some pipelines appear and others don’t.
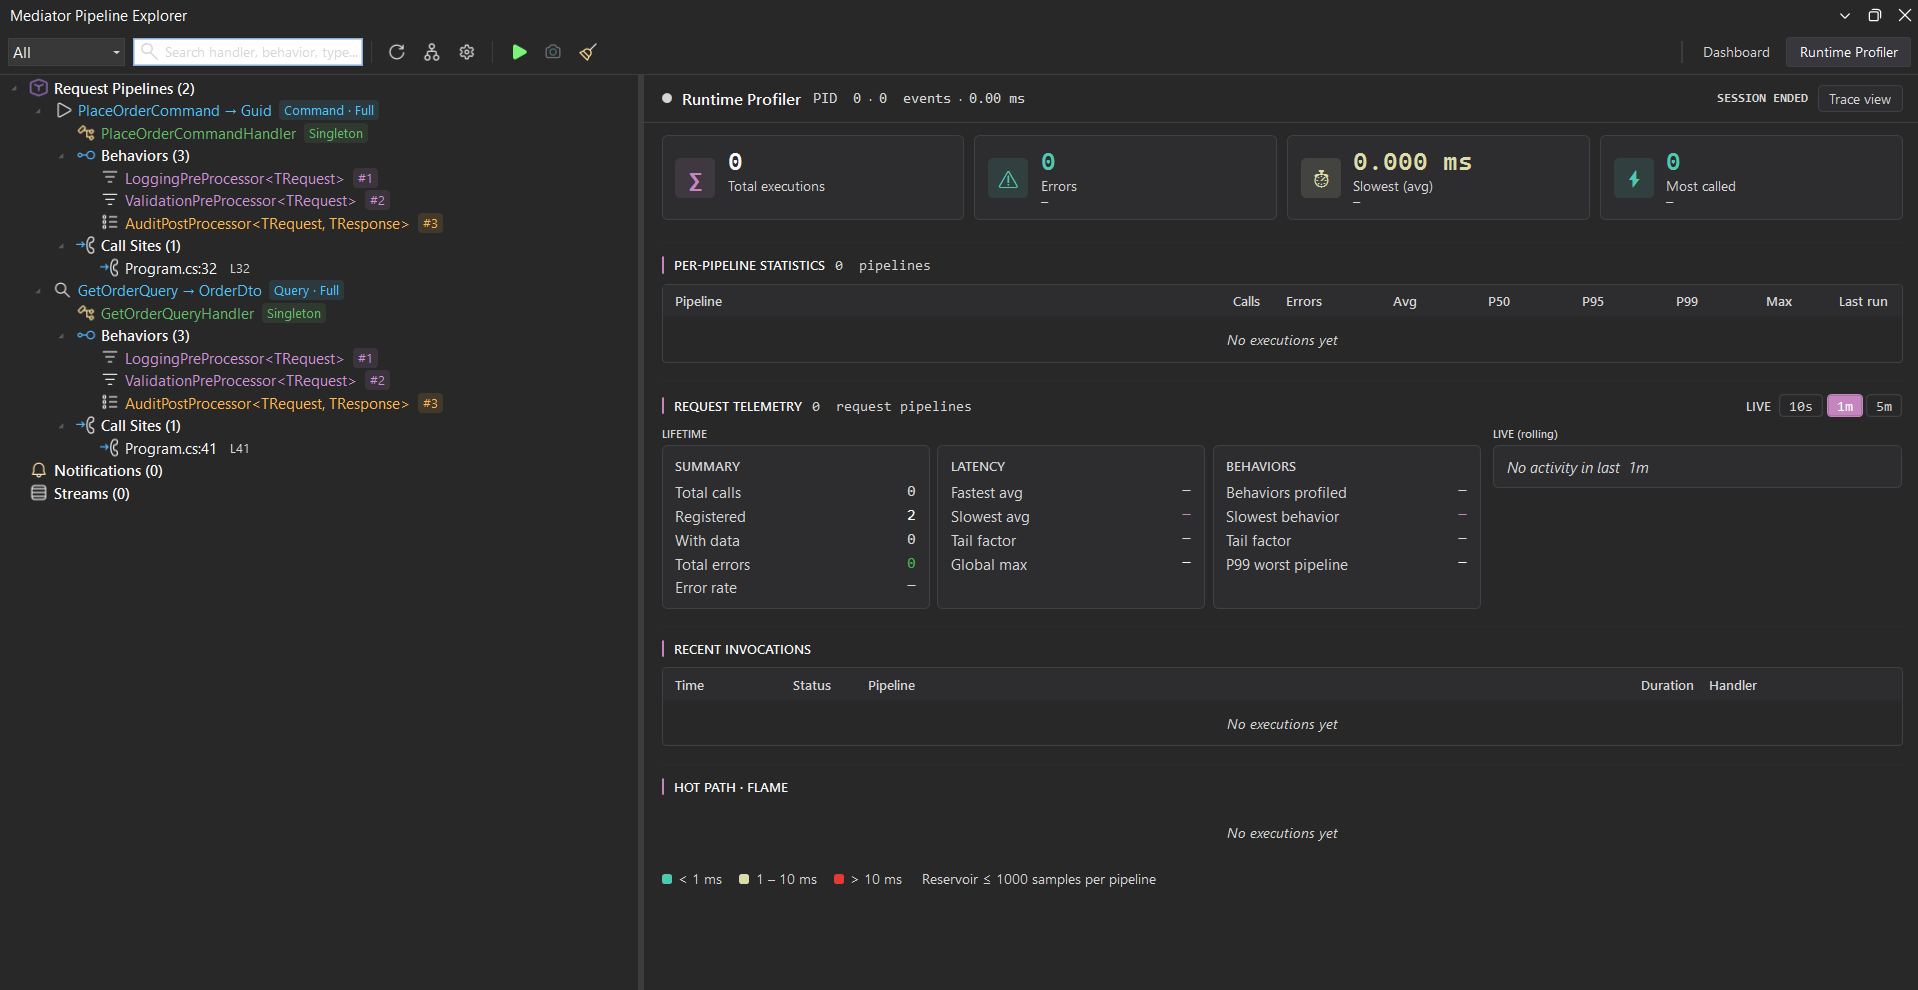
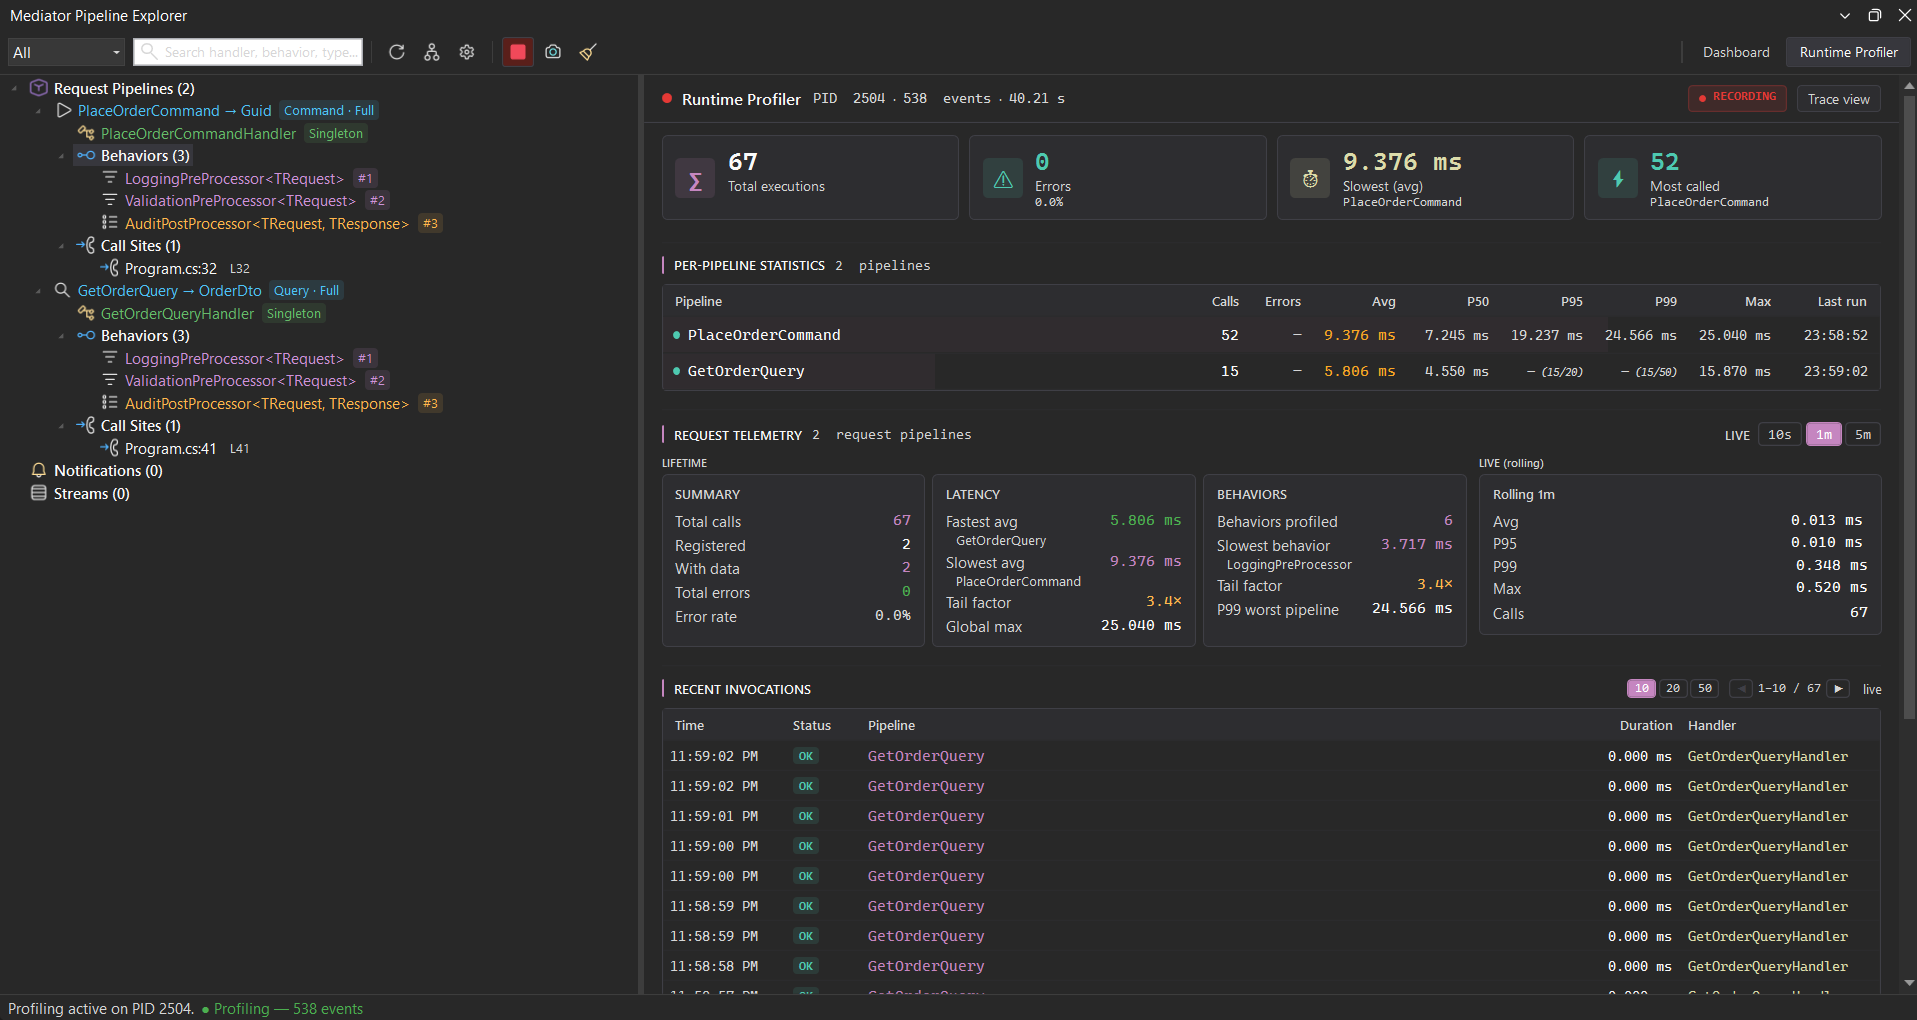
When everything is wired correctly the profiler fills with live data — total executions, per-pipeline percentiles (p50 / p95 / p99), request telemetry, and a recent-invocations log — updating as new events arrive:
Important: Pipeline Explorer wires
AddMediatorProfiling()into your application automatically via C# 12 interceptors. You do NOT need to add any line toProgram.cs— referencing the analyzer (which the extension auto-injects for you) is enough. If profiling isn’t working, the wiring failed for one of the reasons below.
1. The application isn’t actually running
The IDE button only enables profiling on the IDE side. Events flow only when your application is running and dispatching requests through the mediator. Clicking Start without running the application leaves the profiler attached but with zero events — the status shows profiling is on, but no executions ever arrive.
Check
- Is your API / worker / test runner actually started?
- Are requests being dispatched? (Curl an endpoint, fire a test, replay a message.)
Fix
Run the application and issue at least one request that goes through the mediator pipeline. Within a second or two, events should appear in the Profiler panel.
If you are running the application from inside the same IDE (F5 in Visual Studio, “Run and Debug” in VS Code), confirm the run target is the project that wires AddMediator(...). A common mistake is to run a different startup project that doesn’t call into the mediator.
2. Profiling was disabled at build time
The auto-wiring is gated on the MSBuild property DSoftMediatorProfilingEnabled. When it is false, the source generator emits nothing and the auto-registration disappears entirely — no profiling code exists in the produced IL.
The default value is false — profiling is off until something turns it on. When the Pipeline Explorer extension is active, the IDE tooling enables it for you, but only in your profiling configurations (Debug by default), and it is force-disabled for AOT, trimmed, CI, and publish builds. So a Release / CI / AOT / publish build produces zero events even though DSoftMediatorProfilingEnabled is never literally set to false — searching your project files for it set to false comes up empty. Use the Profiling Configurations… command to control which build configurations opt in.
The extension sets this property machine-local (under $(MSBuildUserExtensionsPath)); older versions used to write it into your solution’s Directory.Build.props.
Check
Search your solution for DSoftMediatorProfilingEnabled. If you find it set to false, that is the cause:
<DSoftMediatorProfilingEnabled>false</DSoftMediatorProfilingEnabled>
Fix
Set it explicitly to true:
<PropertyGroup>
  <DSoftMediatorProfilingEnabled>true</DSoftMediatorProfilingEnabled>
</PropertyGroup>
Then rebuild the affected project so the source generator runs again. To turn profiling on or off per build configuration, use the Profiling Configurations… command rather than editing this property by hand.
3. The analyzer isn’t loaded in the project that calls AddMediator
The auto-registration only fires in projects that pick up the Pipeline Explorer analyzer and reference the main DSoftStudio.Mediator package (which provides MediatorBuilder). If your composition root lives in a project that doesn’t satisfy both conditions, the interceptors are never generated and profiling never wires itself in.
Check
In the project that contains your services.AddMediator(...) call:
-
Confirm
DSoftStudio.Mediatoris referenced (directly or transitively):dotnet list <project>.csproj package | findstr Mediator -
Confirm the analyzer is loaded. The extension injects it machine-local — under
$(MSBuildUserExtensionsPath)\DSoftStudio.Mediator\enabled.props, not into your repo. (Older versions wrote a<!-- BEGIN/END DSoftStudio.Mediator -->block into the solution-rootDirectory.Build.props; those legacy repo markers are now actively stripped, so a missing block there is expected and not the problem.)
Fix
- If the package reference is missing:
dotnet add package DSoftStudio.Mediator. - If the analyzer injection is missing: open the extension’s Settings panel, toggle Diagnostics enabled off, then on. The machine-local injection runs again.
- Rebuild.
4. The application uses a different mediator instance
Profiling auto-injects at the services.AddMediator(...) call site. If your application creates a separate mediator instance via new Mediator(...) or a side IServiceCollection, that instance is invisible to the profiler.
Check
Look for any code that constructs a mediator directly or builds a second container:
var mediator = new Mediator(...);          // ← profiler can't see this
var services = new ServiceCollection();    // ← second container, also invisible
services.AddMediator(...);
Fix
Resolve IMediator from the same DI container that received the AddMediator(...) call your application boots with. If you have a legitimate reason to use a second container (testing, isolated subsystems), the same auto-registration fires there too — it just needs to call through AddMediator(...).
5. The buffer is full and dropping events
Pipeline Explorer caps profiling events at mediator.maxBufferedEvents (default 2000). When the buffer is full, the oldest events are dropped first (FIFO). If you fire many thousands of requests in a few seconds with the default cap, you may see only the most recent ones.
Check
The profiler shows the captured-event count. If it plateaus at the cap and earlier events are missing, the buffer is your bottleneck.
Fix
Raise the cap (up to 50,000):
// settings.json (VS Code)
{
  "mediator.maxBufferedEvents": 20000
}
…or open the settings panel in Visual Studio and bump the value there.
6. Direct handler resolution bypasses the mediator
If specific handlers are missing but the panel is otherwise populating, the most likely cause is handler resolution outside the mediator dispatch path. The profiler instruments IMediator.Send() / IMediator.Publish(); direct handler invocation bypasses the hooks.
Check
Search for direct handler resolution:
var handler = serviceProvider.GetRequiredService<IRequestHandler<MyCmd, Result>>();
await handler.Handle(cmd, ct);     // ← bypasses mediator, no event emitted
Fix
Dispatch through the mediator:
var mediator = serviceProvider.GetRequiredService<IMediator>();
await mediator.Send(cmd, ct);      // ← profiled
This is the same pattern that gives you pipeline behaviors — direct invocation also bypasses every behavior, not just the profiler.
7. The host is short-lived
Console apps and integration tests that exit immediately after a single dispatch may finish before the profiling event reaches the IDE. The transport is asynchronous; the host has to live at least a few hundred milliseconds after the last dispatch.
Check
Is your application a console app that exits right after mediator.Send(...)?
Fix
Add a small delay at the end of your test / console run so the profiler has time to flush the last events before the process exits:
await Task.Delay(500); // give the profiler time to flush
For long-running services (APIs, workers, daemons), this is not an issue.