
Pipeline Explorer
Architectural and runtime observability for DSoftStudio.Mediator — directly inside Visual Studio Code and Visual Studio.
Find bottlenecks faster. Understand mediator pipelines in minutes. Turn traces into actionable insights.
Pipeline Explorer is a commercial IDE extension that scans your solution, discovers every IRequestHandler, IStreamRequestHandler, and INotificationHandler, and presents the full pipeline graph — handlers, behaviors, pre/post-processors, notification fan-out, nested mediator calls — alongside the runtime telemetry you need to make it fast.
Why use it
Mediator-heavy applications become hard to reason about as they grow:
- Hidden behaviors silently wrap every dispatch — validation, logging, retry, transactions — and nobody remembers the chain.
- Nested mediator calls inside handlers turn a single endpoint into a dozen invocations the IDE won’t show you.
- Notification fan-out scatters business effects across projects; tracing them needs grep and luck.
- Performance bottlenecks hide behind generic pipeline traces — which behavior is slow, on which request?
- Cross-project handlers live in
*.Application, dispatched from*.Api, decorated in*.Infrastructure— no single source file tells the story.
Pipeline Explorer answers all of these in seconds, with one click to source.
What you can do
| Capability | Outcome |
|---|---|
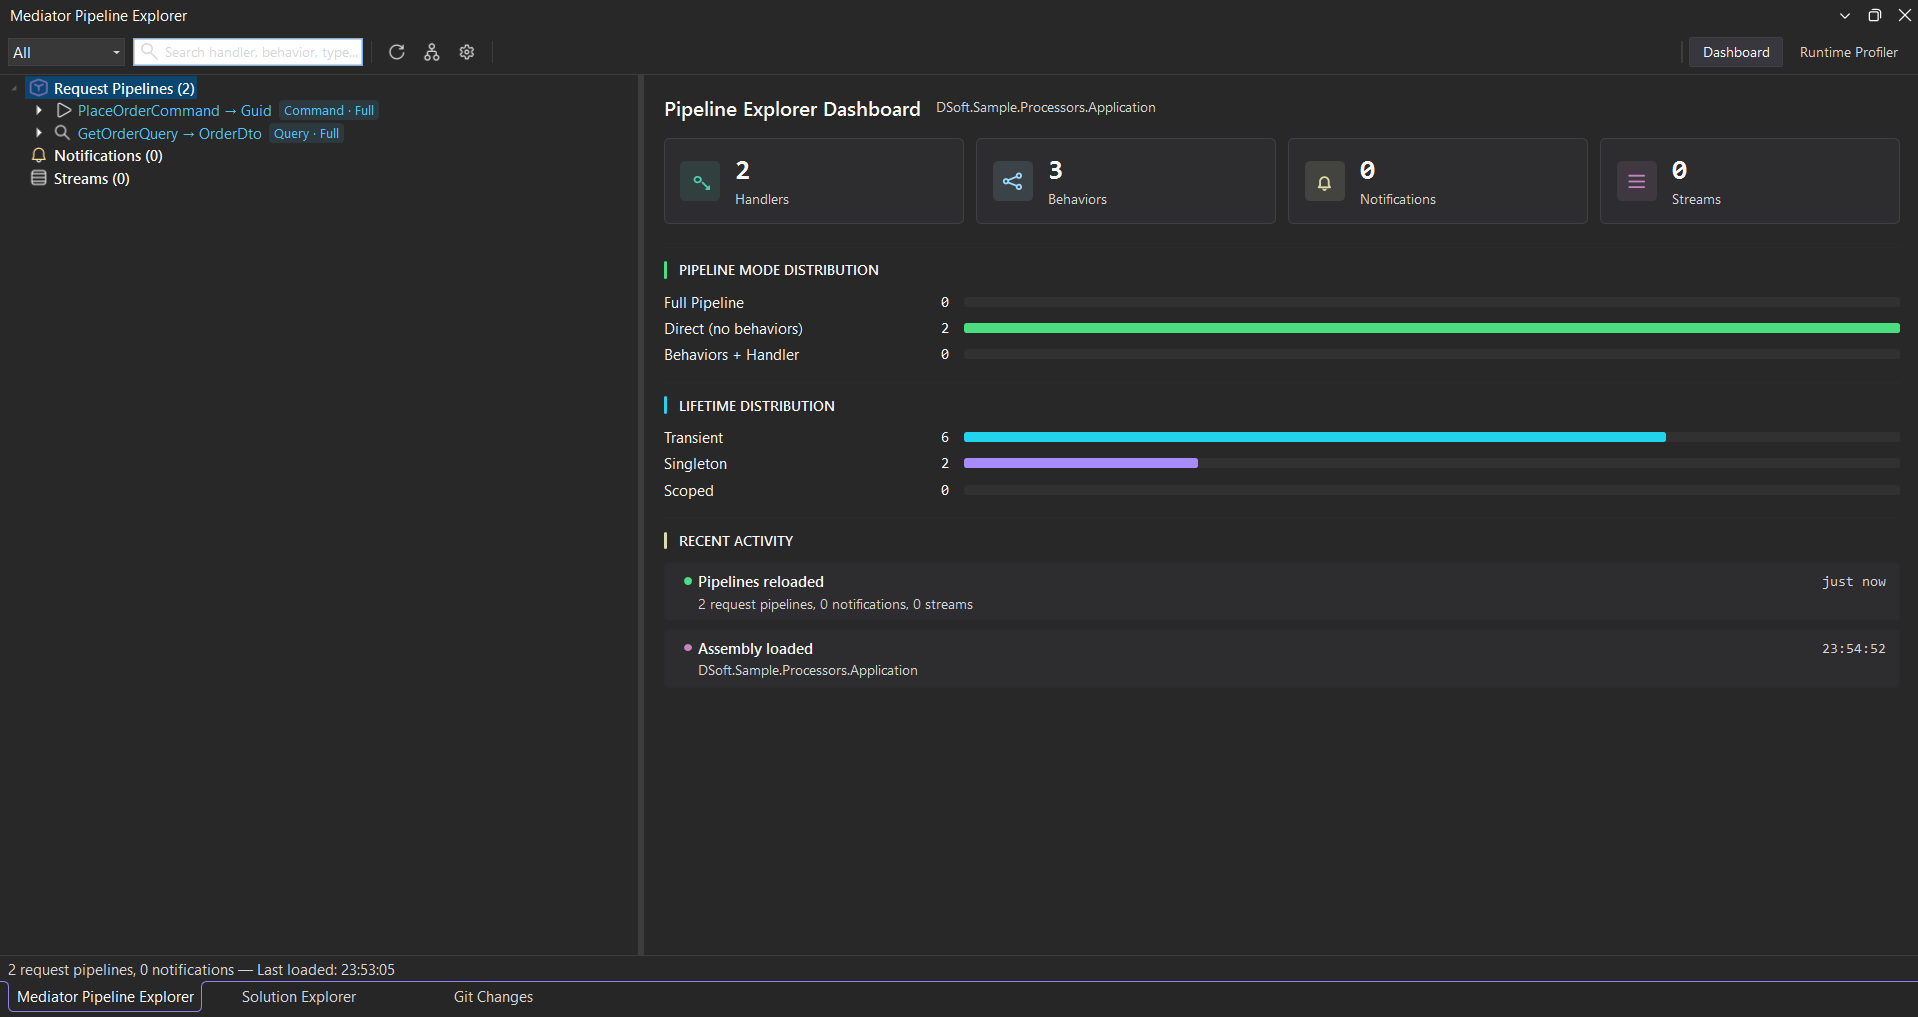
| Pipeline tree explorer | Browse request pipelines (commands & queries), notifications, and streams, with at-a-glance badges and live counts. |
| Click-to-source navigation | Click any node — handler, behavior, call site — and the IDE opens the file at the right line. |
| Interactive pipeline graph | See pre-processors → behaviors → handler → post-processors visualized per pipeline, with notification fan-out and nested calls inline. Detach it into its own window, and overlay per-node timing + health badges once profiling is on. |
| Runtime profiler | Live handler / behavior timings with p50 / p95 / p99 percentiles, error rates, and tail-heavy detection — plus per-pipeline statistics, request telemetry, and a Hot Path / Flame breakdown of where each request spends its time. |
| CQRS-aware view | Pipelines tagged automatically by ICommand<> / IQuery<> / IRequest<> with distinct icons and filters. |
| Search & filters | Find any handler, behavior, or call site by type name; filter the tree by Commands / Queries / Notifications / Streams. |
Notification fan-out at a glance
Every notification you publish gets its own detail panel — a single view that maps the exact-type dispatch model, lists every subscribed handler, and (once profiling is on) reports the per-handler runtime cost so you can see which subscriber is the slow one without grepping log files.
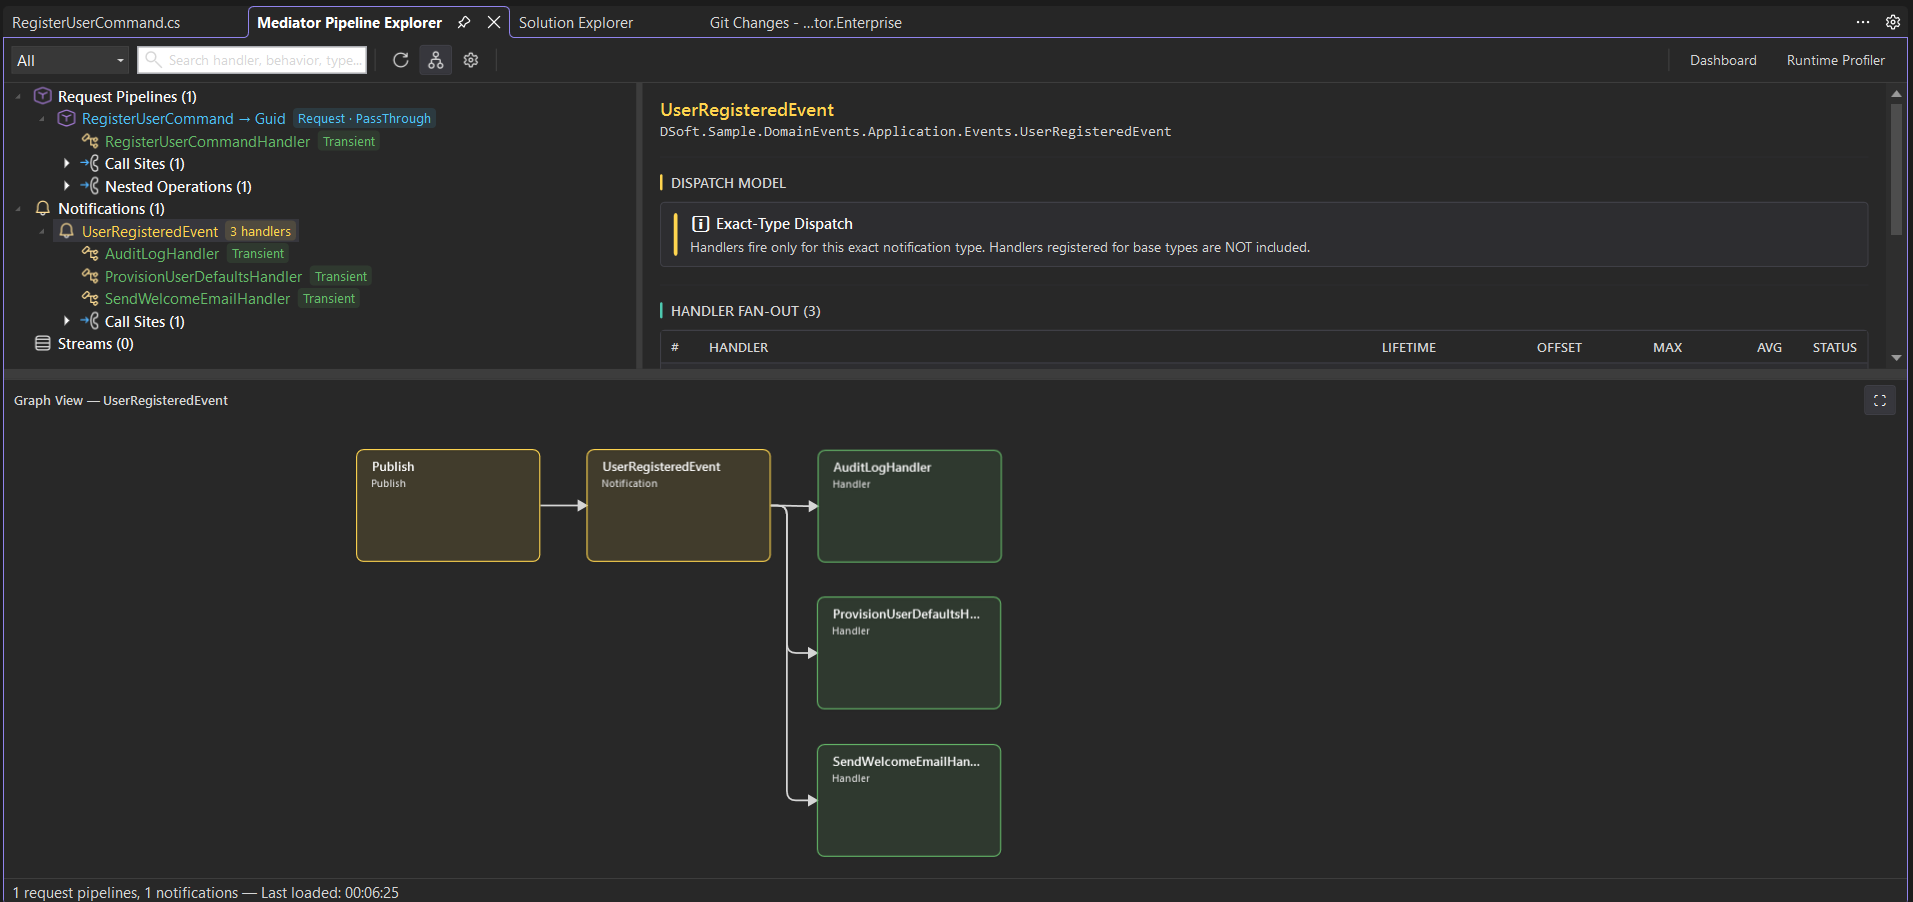
UserRegisteredEvent, and the Publish → fan-out graph below.Get started
- Installation — Install on Visual Studio Code and Visual Studio, activate your license.
- Quick Start — Your first solution scan, profiling session, and source navigation.
Integrations
- OpenTelemetry bridge — feed the flame with enriched, source-mapped dependency spans (PostgreSQL, HTTP) from
DSoftStudio.Mediator.OpenTelemetry, imported from a production trace or captured live.
Troubleshooting
Quick answers to the issues most often hit by new users:
- Empty pipeline tree
- Build errors after installing
- Server startup failed
- Profiler not attaching
- License activation failed
See the full troubleshooting hub for the diagnostic checklist and full list.
Available editions
Pipeline Explorer ships as two editions that share the same backend, the same data model, and the same workflow:
- Visual Studio Code extension — available on the VS Code Marketplace. Bundled server auto-spawns on Windows, macOS, and Linux.
- Visual Studio extension — available on the Visual Studio Marketplace. Visual Studio 2022 17.0+ and 2026.
A single license activates both editions.
Licensing
Pipeline Explorer is commercial software. During the launch window, a free access period lets you evaluate every commercial feature against your real codebase — no payment method required. After it ends, a subscription keeps the commercial features unlocked; either way, your code keeps compiling and running on the MIT-licensed core.
- Pricing & plans
- Terms of Service
- Licensing inquiries: licensing@dsoftstudio.com