
Empty pipeline tree
Symptom
You opened a solution but the Pipeline Explorer shows No pipeline data found — empty Request Pipelines, Notifications, and Streams — even though your project contains mediator handlers.
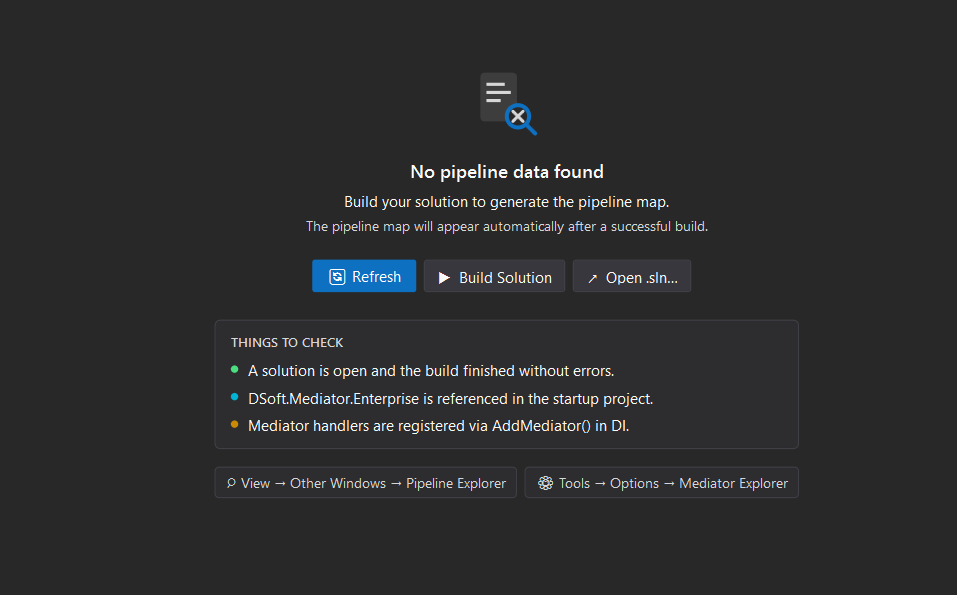
This page walks through the five most common causes in order of likelihood.
1. No .sln file in the workspace
Pipeline Explorer discovers handlers per solution, not per folder. If you opened a bare folder or a single .csproj, the extension has nothing to scan.
Check
- VS Code: open the file explorer and confirm a
.slnfile is at the workspace root. - Visual Studio: confirm a solution (not just a project) is open. The title bar shows the solution name.
Fix
Open the folder that contains the .sln, or open the .sln directly. Click Refresh in the toolbar after the workspace reloads.
2. No project references DSoftStudio.Mediator
Discovery iterates over every project in the solution — projects that don’t reference the DSoftStudio.Mediator NuGet package simply yield no handlers. If no project references the package, the tree stays empty.
Check
Run from the solution root:
dotnet list package | findstr Mediator
(Use grep Mediator on macOS / Linux.) The output should include DSoftStudio.Mediator.
Fix
dotnet add package DSoftStudio.Mediator
After the package is added, build the solution once, then click Refresh in the Pipeline Explorer toolbar.
3. The solution has never been built
Pipeline Explorer discovers handlers from a generated encrypted source map (PipelineMap.g.json.cs) or by analyzing the Roslyn compilation — not from compiled assembly metadata. When the requireBuild setting is enabled, a solution that has never been compiled has nothing for discovery to read.
Check
Look for bin/ and obj/ folders inside each project. If they are missing, the project has not been built.
Fix
dotnet build
Once the build succeeds, click Refresh in the toolbar.
4. Diagnostics are disabled in the project
If DSoftMediatorDiagnosticsEnabled is set to false in your Directory.Build.props or a project file, the analyzer skips emission and Pipeline Explorer sees no metadata.
Check
Search the solution for DSoftMediatorDiagnosticsEnabled. If it exists and is false, that is the cause.
Fix
Set the property to true (or remove it — the default is true):
<PropertyGroup>
  <DSoftMediatorDiagnosticsEnabled>true</DSoftMediatorDiagnosticsEnabled>
</PropertyGroup>
Rebuild and refresh.
The VS Code extension exposes this toggle as the
mediator.diagnosticsEnabledsetting. Visual Studio exposes it under the gear icon in the tool window toolbar.
5. The server crashed or hasn’t started
Pipeline Explorer talks to a bundled background server that performs the actual discovery. If the server failed to start, the tree stays empty.
Check
- VS Code: open the Output panel (
Ctrl+Shift+U) and select Mediator Server from the dropdown. Look for a line confirming the server started. If you see startup errors, see server startup failed. - Visual Studio: open View → Output and select DSoftStudio Mediator in the Show output from dropdown.
Fix
Restart the server: run Mediator: Stop Server from the Command Palette (VS Code) or close and reopen the tool window (Visual Studio). The server respawns automatically on the next refresh.
If the restart does not help, see server startup failed.