
Quick Start
By the end of this guide you will have scanned your first solution, navigated to a handler in one click, and watched live profiling data flow in.
This walkthrough assumes you have already installed the extension and opened a solution that references DSoftStudio.Mediator. The core workflow is the same in Visual Studio Code and Visual Studio, and the screenshots below are drawn from both. A few features are Visual Studio-only, however — detaching/docking the graph, the section-filter dropdown, and some context-menu commands — and those differences are called out inline as you reach them.
1. Open your solution
Open a folder that contains a .sln file referencing DSoftStudio.Mediator. The Pipeline Explorer view auto-activates as soon as the .sln is detected:
- VS Code — click the Mediator Pipelines icon in the Activity Bar.
- Visual Studio — open View → Other Windows → Mediator Pipeline Explorer, or right-click the solution in Solution Explorer → Open Pipeline Explorer.
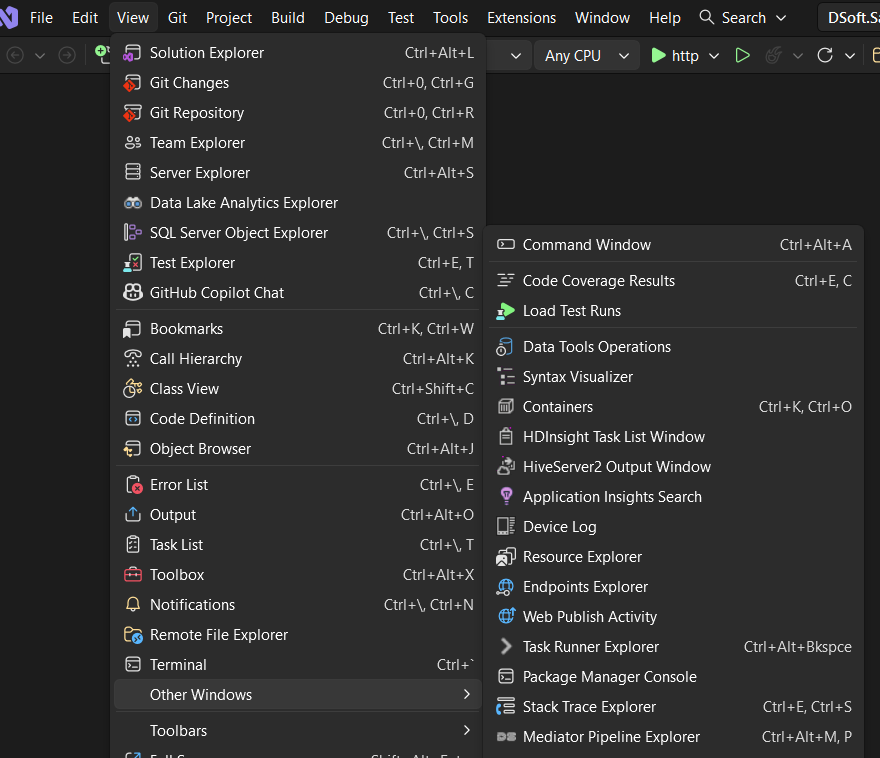
Ctrl+Alt+M, P).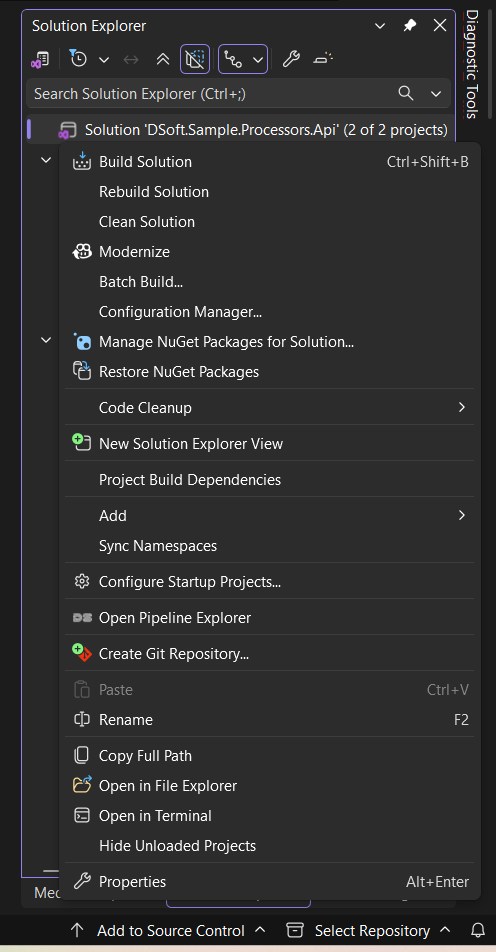
The tree populates with three sections — Request Pipelines, Notifications, and Streams:
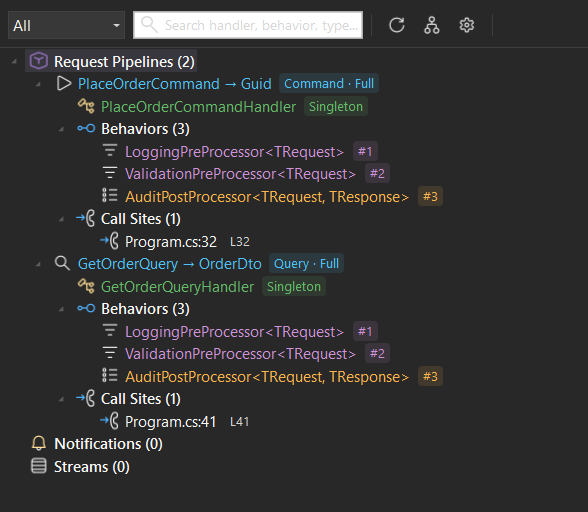
The badge after each request pipeline tells you two things at a glance:
- CQRS kind —
Command,Query, orRequest(when neither marker interface is implemented). - Pipeline mode — Direct (handler only), Behaviors, or Full Pipeline (pre/post-processors + behaviors).
If the tree is empty, click Refresh in the toolbar. If it is still empty after refresh, see Troubleshooting: empty tree.
2. Navigate to source
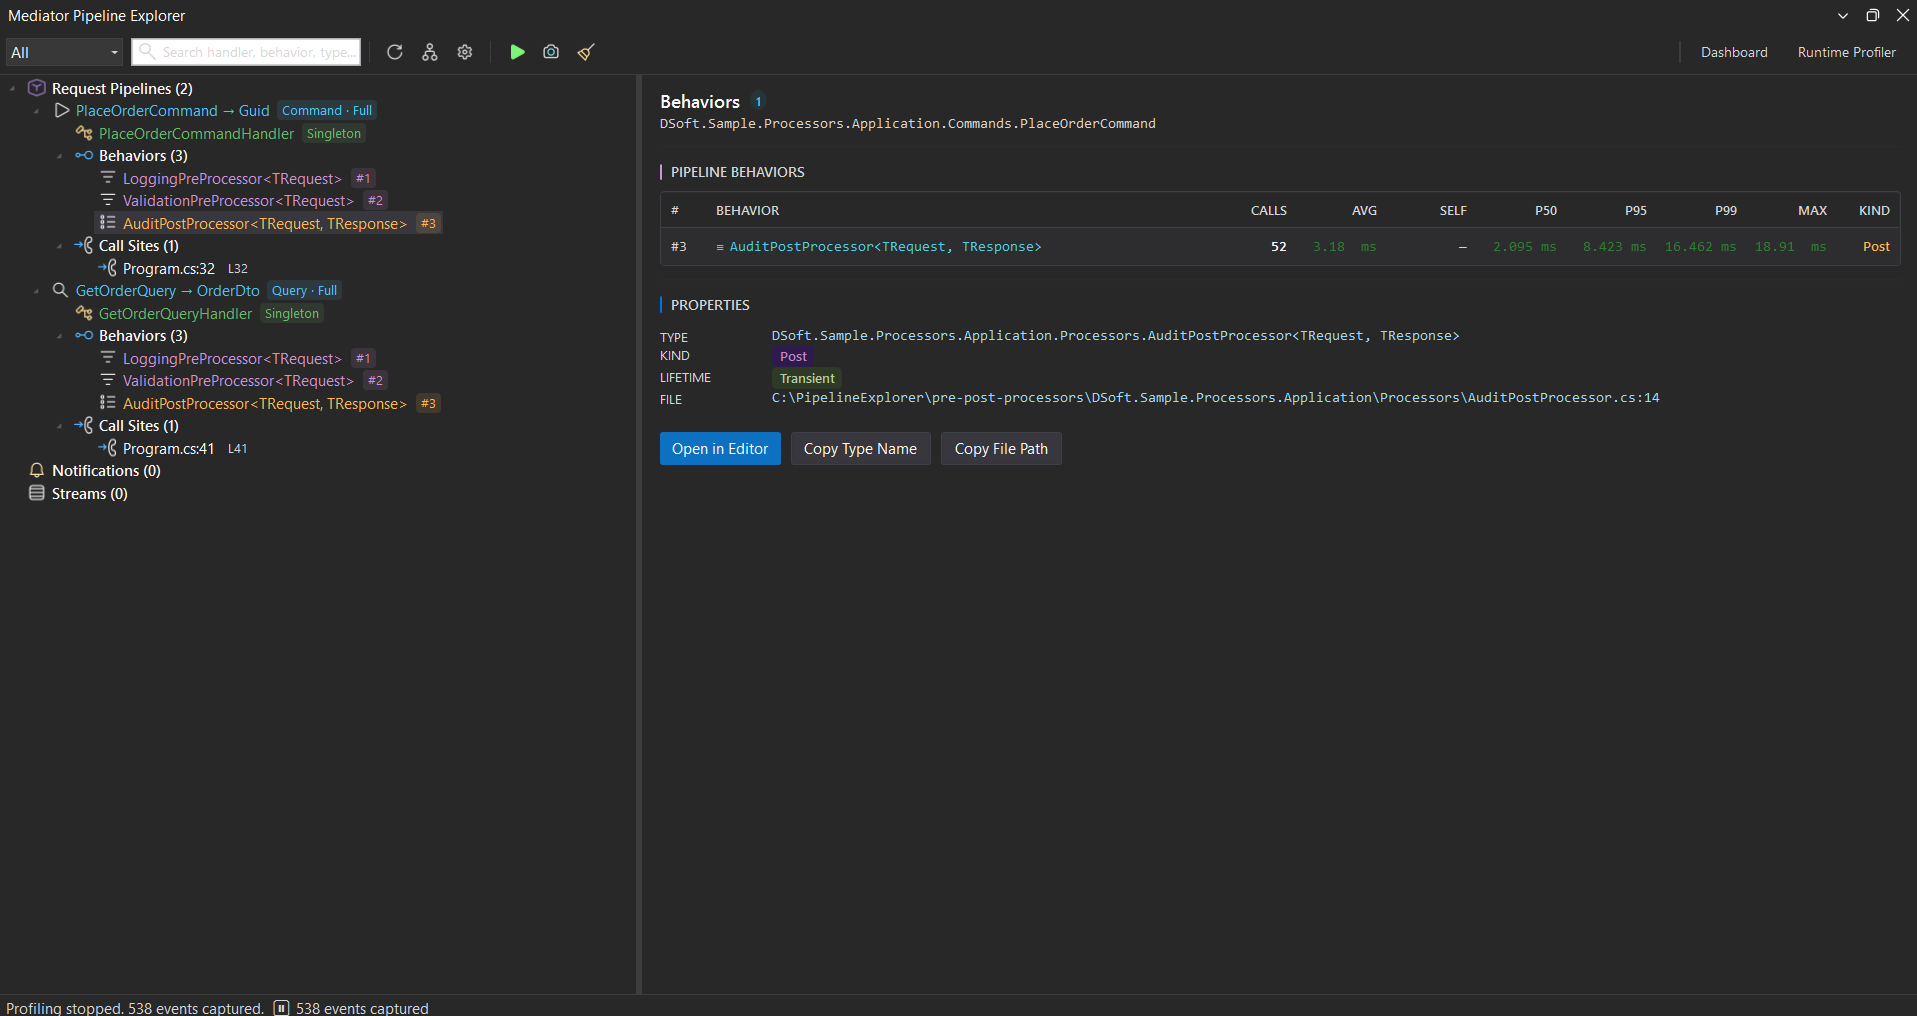
Click any node in the tree. The right-hand detail panel opens with:
- The request and response types
- The handler with its DI lifetime
- Every behavior, pre-processor, and post-processor in execution order
- The call sites that dispatch this pipeline (
controller.cs:42,worker.cs:118)
Click any item — handler, behavior, or call site — and the IDE jumps to the exact line. No Ctrl+T hunt, no manual filename guessing.
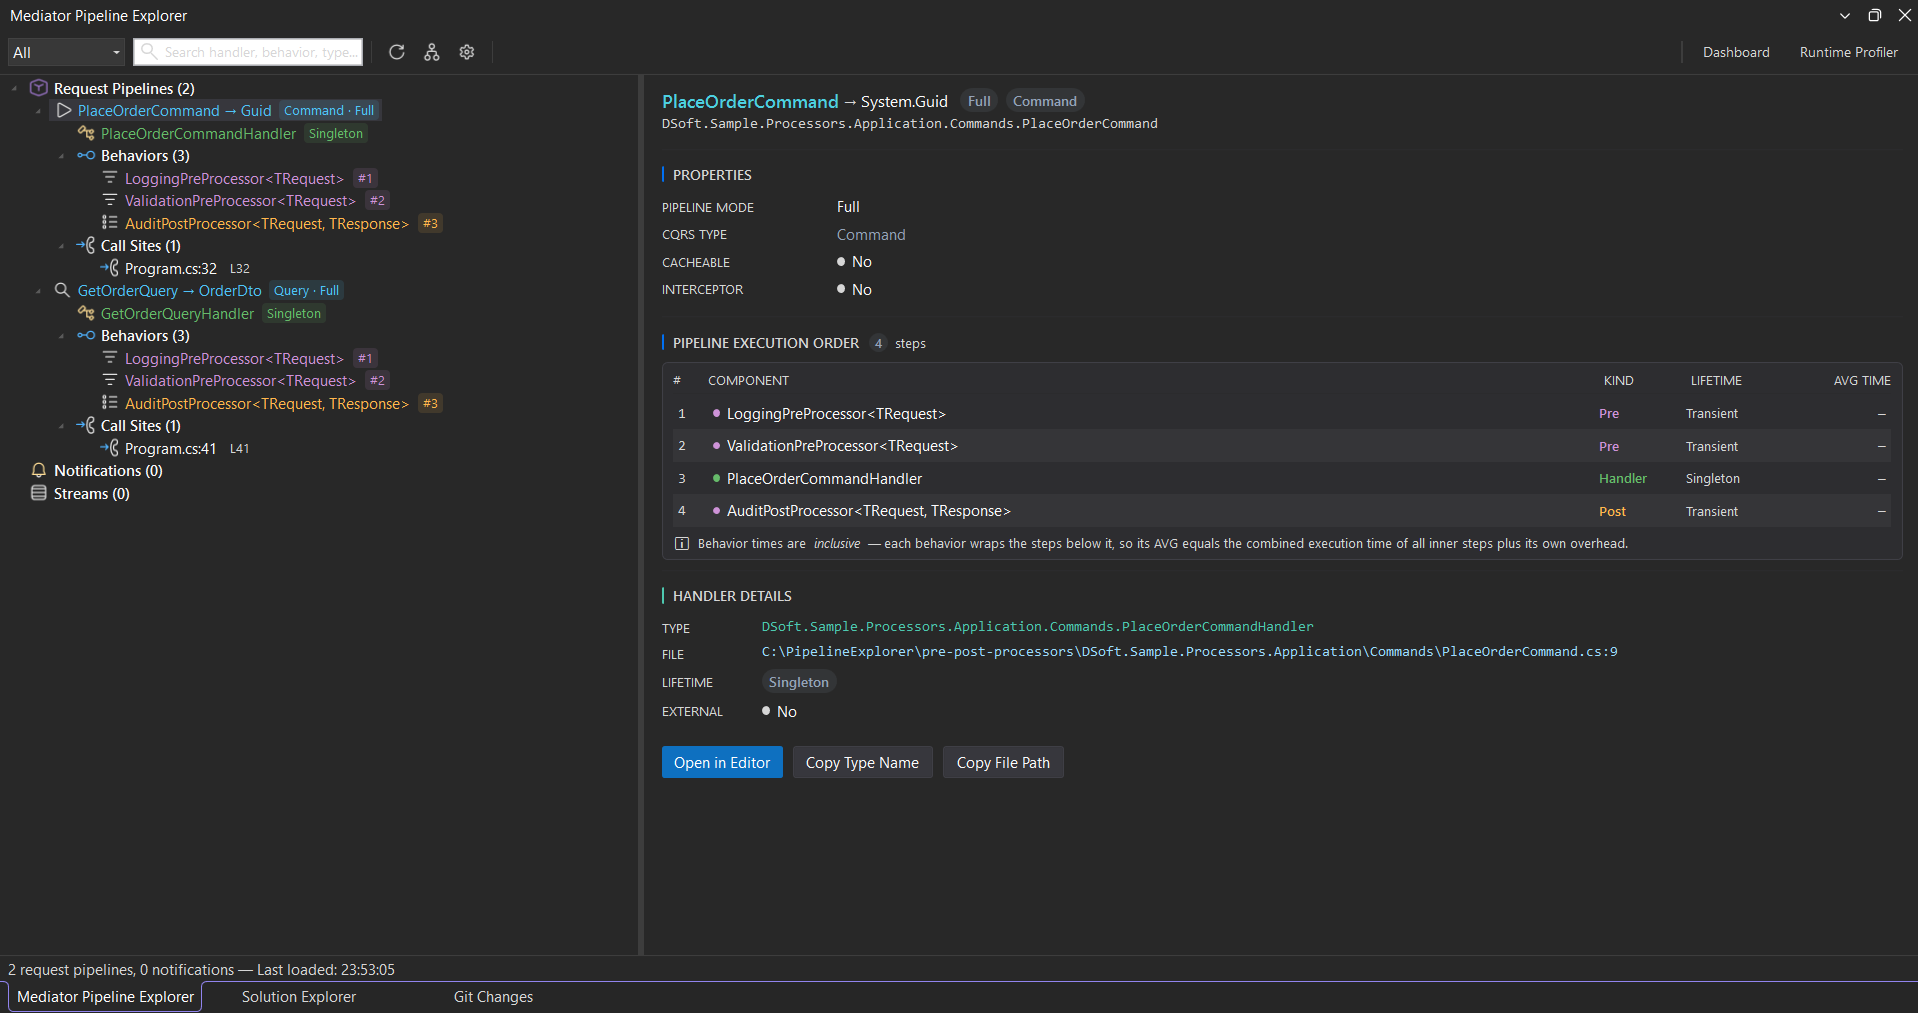
The execution-order table numbers every step in the exact order it runs — pre-processors, behaviors, the handler, then post-processors. Behavior and processor times are inclusive: each wraps the steps below it, so its average equals the combined time of everything it surrounds plus its own overhead.
Tip: right-click any node for a context menu. In Visual Studio it offers Go to Definition, Find All References, Copy Type Name, and Pin to Quick Access. In VS Code it offers Go to Source, Show Pipeline Graph, and Copy Type Name (no Find All References / Pin to Quick Access).
3. Visualize the pipeline graph
The detail panel exposes a graph toggle (the branching icon in the toolbar) that opens the interactive graph.
- Pan — drag empty space.
- Zoom — mouse wheel.
- Click a node — navigates to source in the editor.
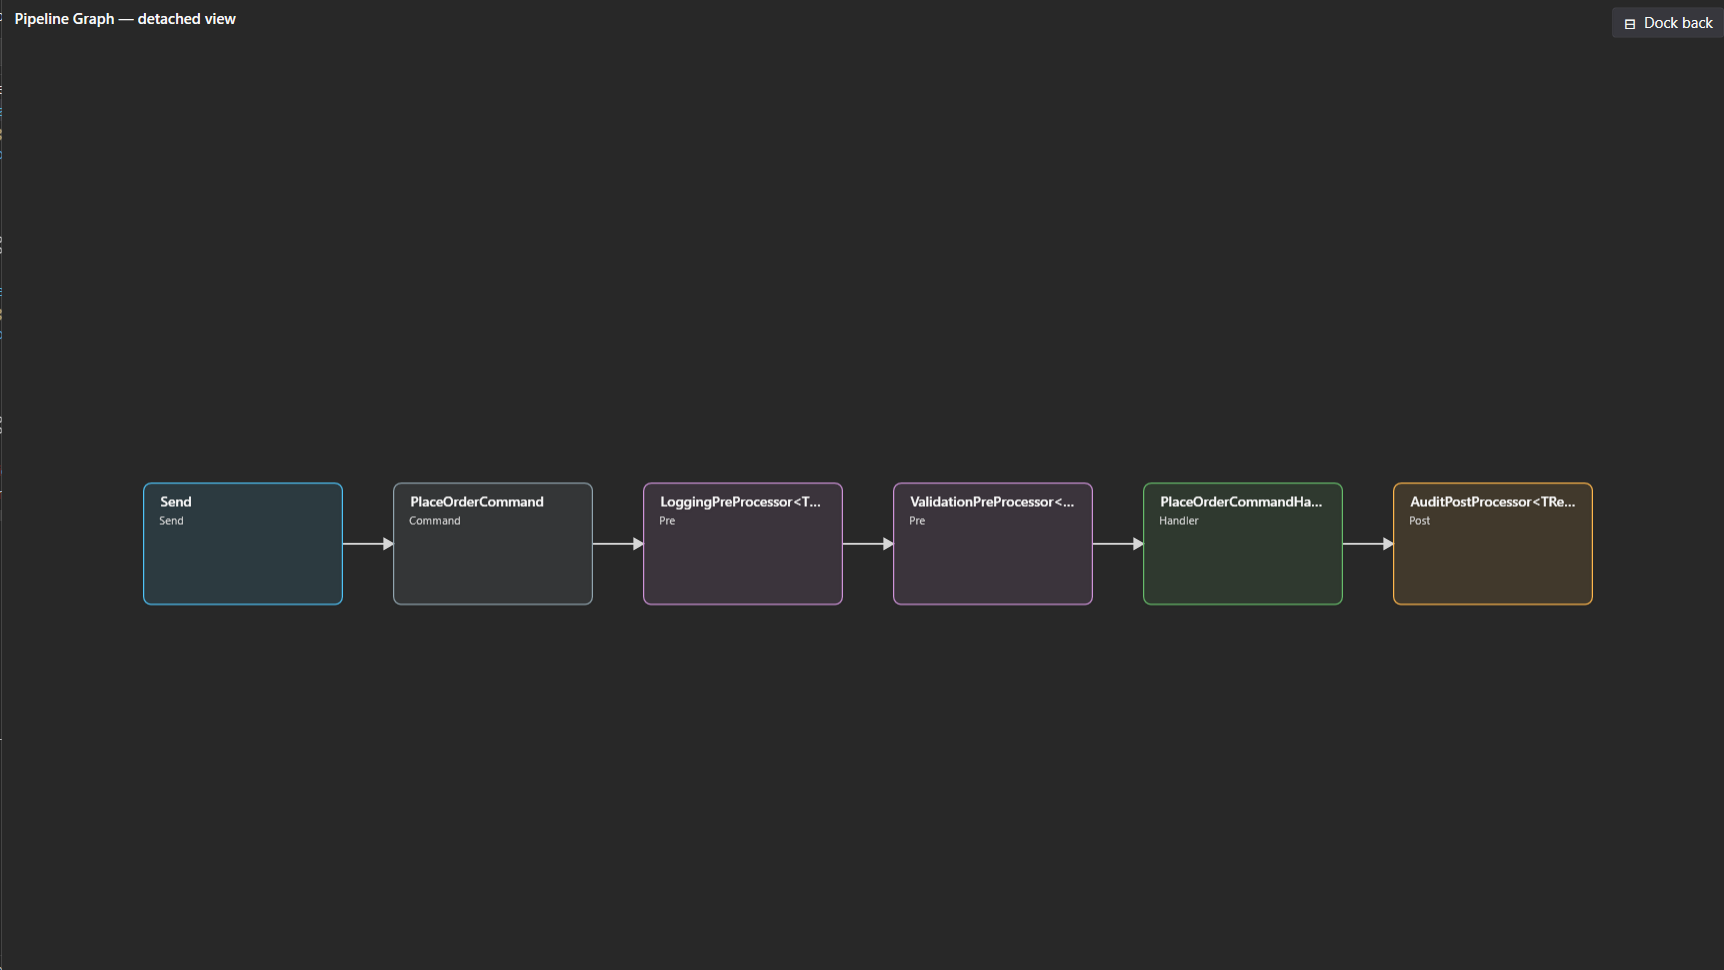
- Detach / Dock (Visual Studio only) — pop the graph out into its own resizable window, then Dock back when you’re done.
The graph lays out the full request flow left to right: Send → request → pre-processors → behaviors → handler → post-processors. In Visual Studio it sits docked beneath the detail panel, so you can read the structure and the step list together; in VS Code it opens as a side-by-side editor tab next to the detail.
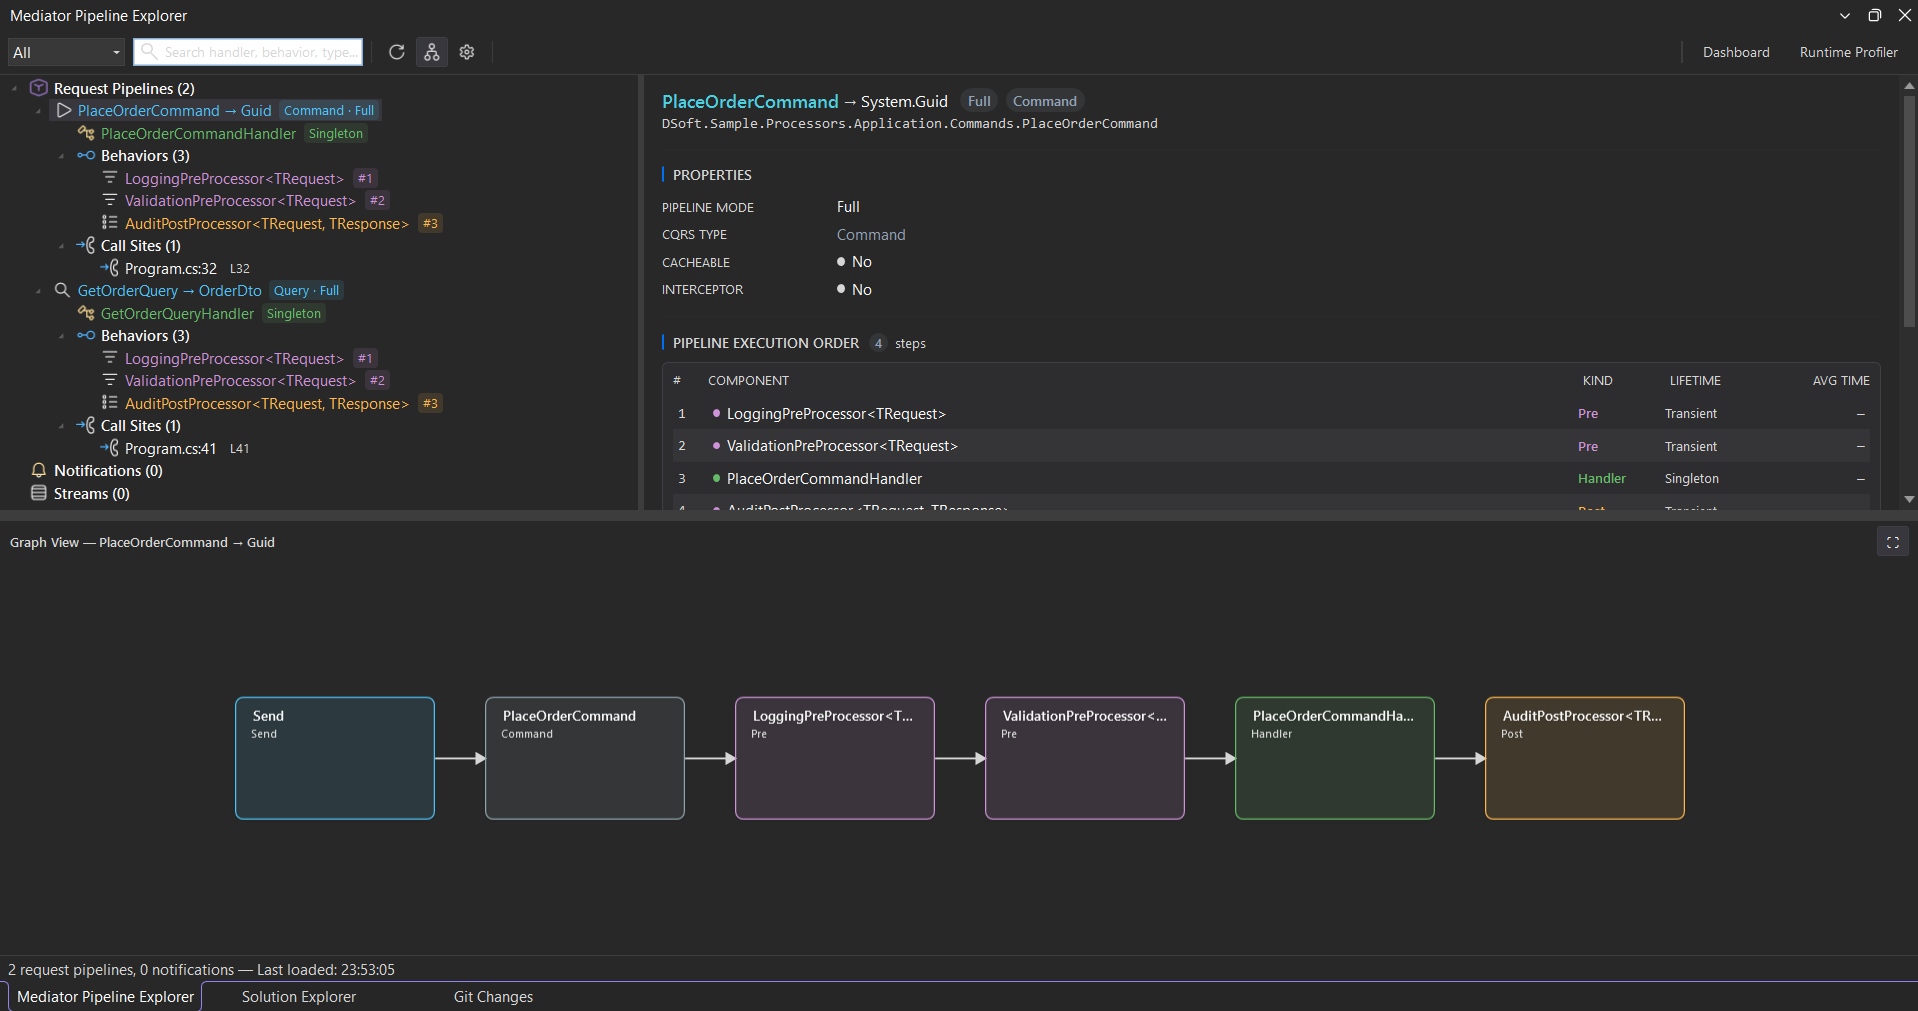
Full pipeline — Send → PlaceOrderCommand → LoggingPreProcessor → ValidationPreProcessor → PlaceOrderCommandHandler → AuditPostProcessor — every node click-to-source.Need more room? In Visual Studio you can Detach the graph into its own window — handy for wide pipelines or walking your team through the flow — then Dock back when you’re done. (In VS Code the graph already opens as a full side-by-side editor tab, so there is no detach/dock step.)
Trace nested calls & notification fan-out
A handler rarely works alone — it often publishes a notification or dispatches another request, and that nested work is exactly what hides from an ordinary stack trace. Pipeline Explorer draws it inline.
- A Nested Operations node appears under any pipeline whose handler calls back into the mediator.
- Publishing a notification from inside a handler is drawn as a
Publishedge that fans out to every subscribed handler.
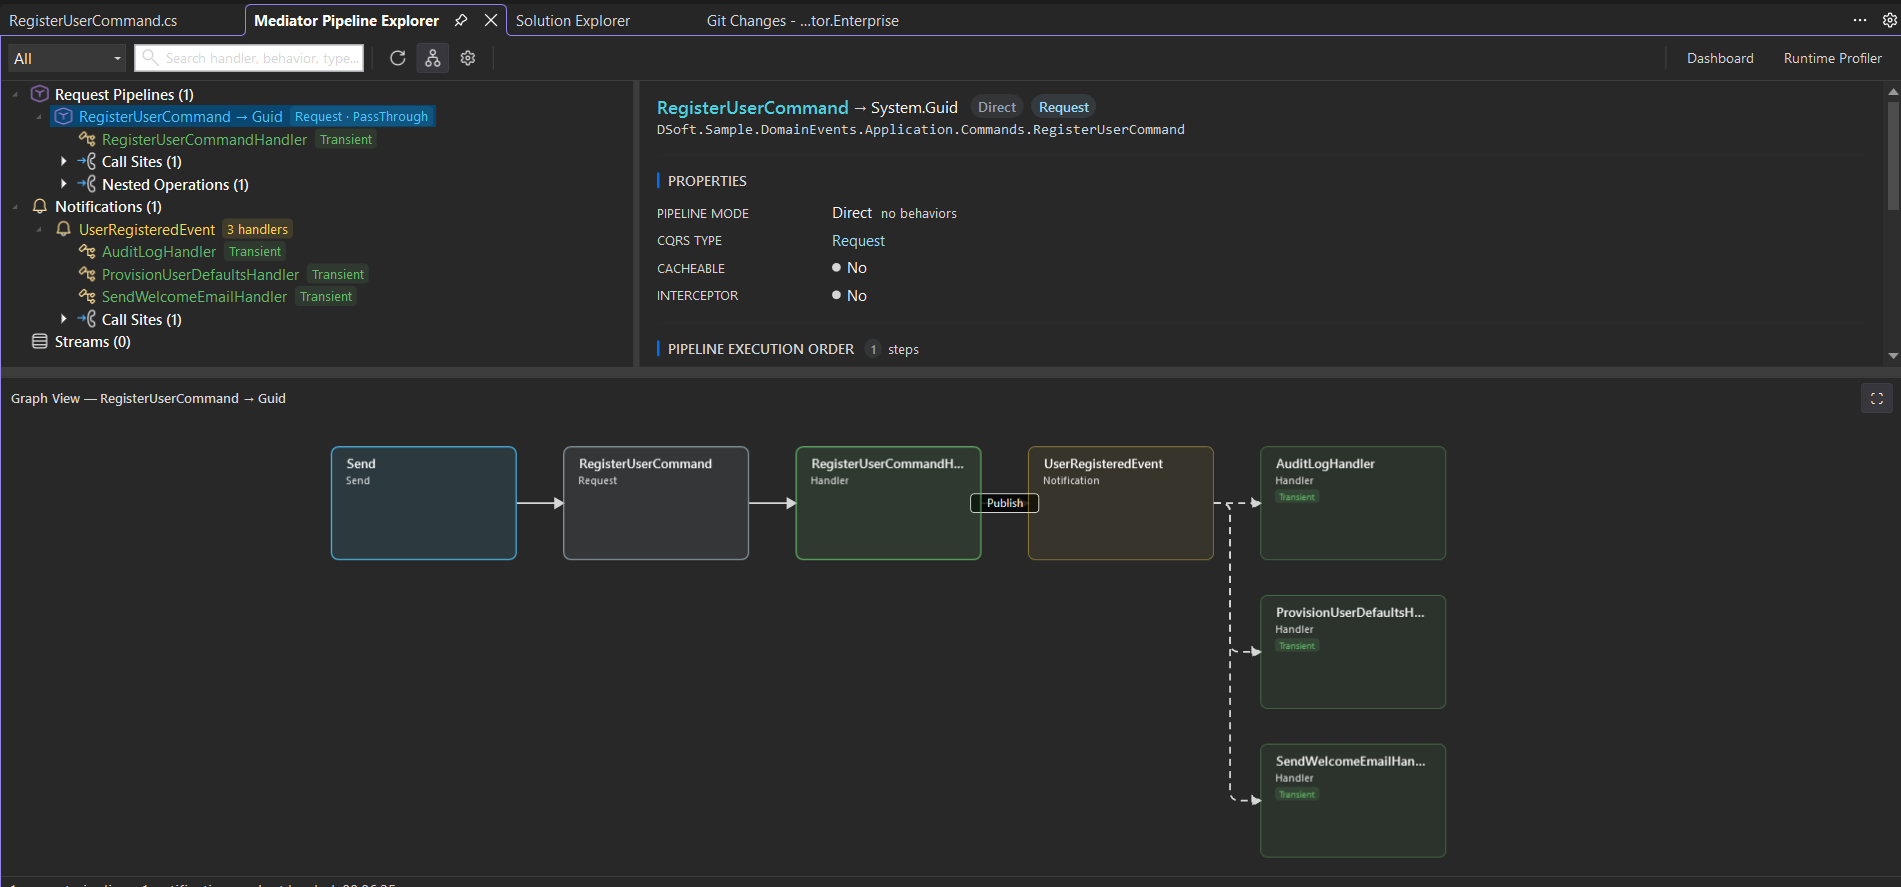
RegisterUserCommand's handler publishes UserRegisteredEvent — the graph draws the Publish edge and the fan-out to all three subscribers, so the full chain of effects is visible from a single pipeline.4. Start runtime profiling
Profiling captures live timings as your code runs. The profiling hooks are wired into your application automatically by the analyzer — there is nothing to add to Program.cs, and nothing is written into your repository. The extension injects the analyzer machine-locally through an MSBuild user-extensions file ($(MSBuildUserExtensionsPath)\DSoftStudio.Mediator\enabled.props), so every build on your machine picks it up without touching your solution’s Directory.Build.props. (Older versions used to write a marked block into the repo’s Directory.Build.props; those legacy markers are now actively stripped.) As long as the project that calls services.AddMediator(...) has the analyzer loaded, the hooks are emitted at compile time with zero allocation overhead until a profiling session is attached.
Attach the profiler
- VS Code — Command Palette →
Mediator: Start Profiling. - Visual Studio — click Start (▶) in the tool window toolbar.
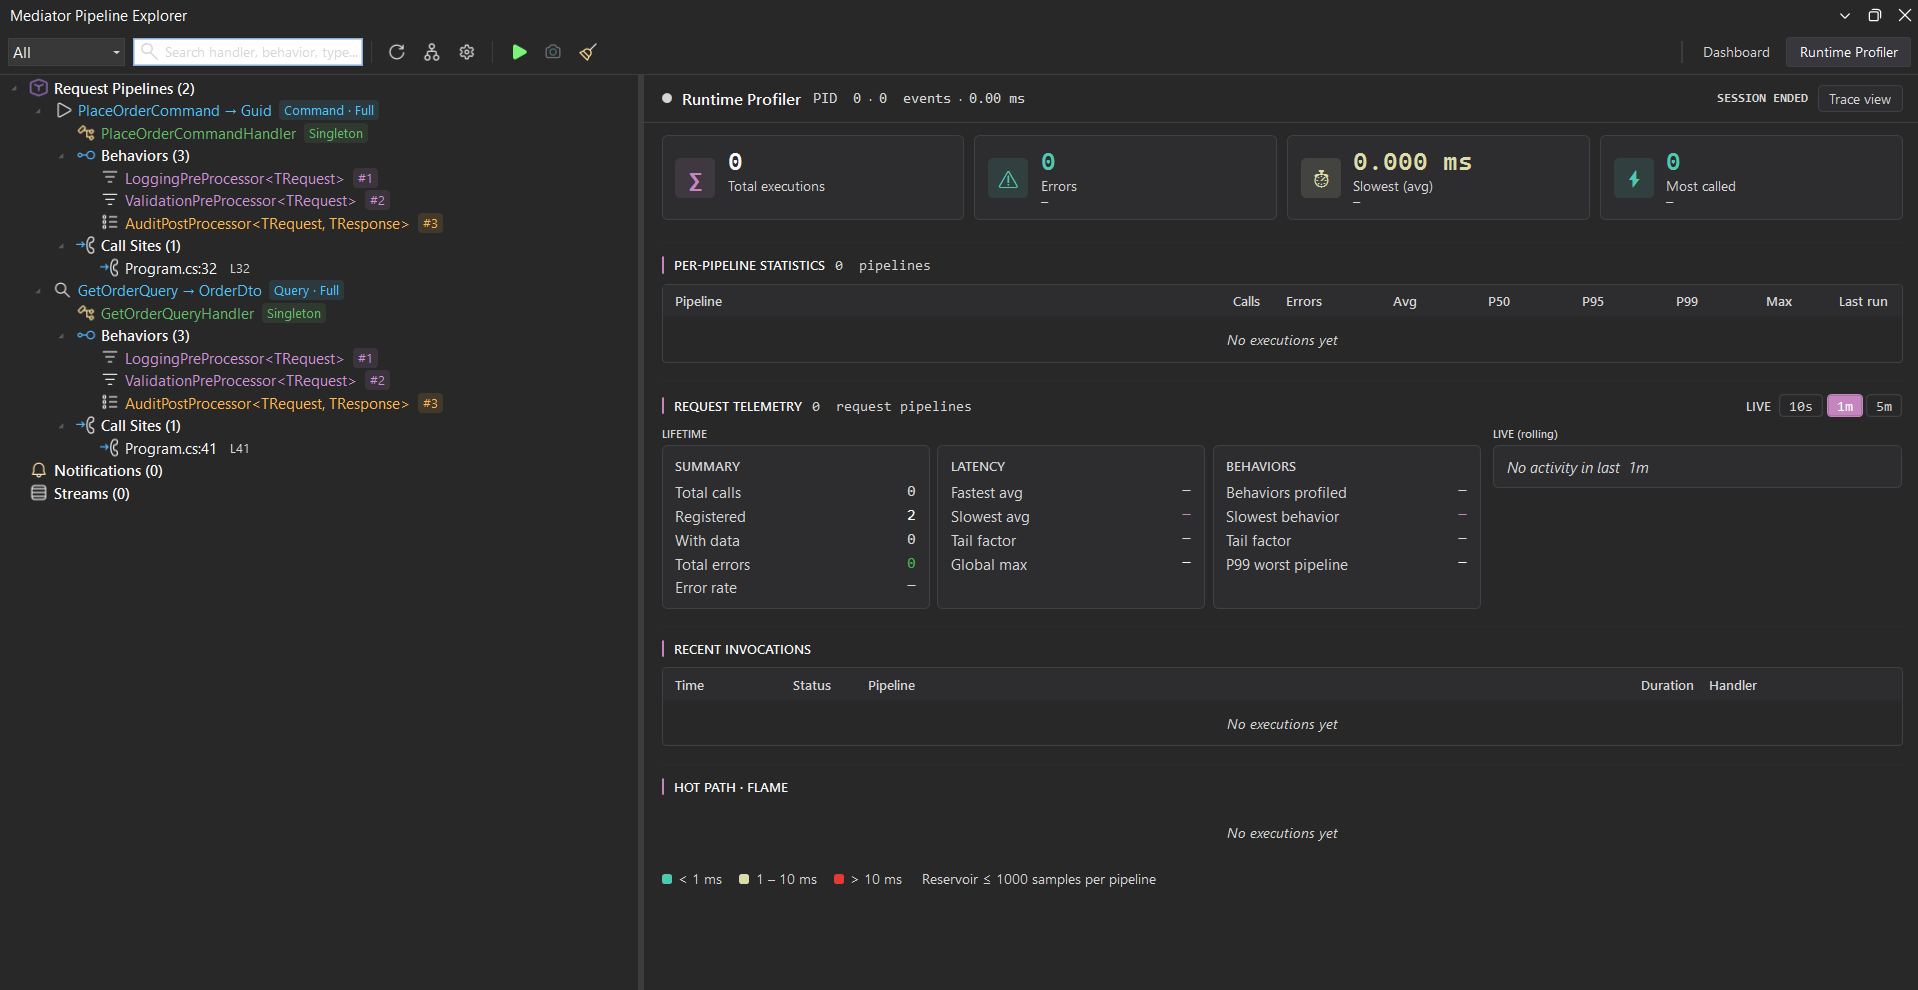
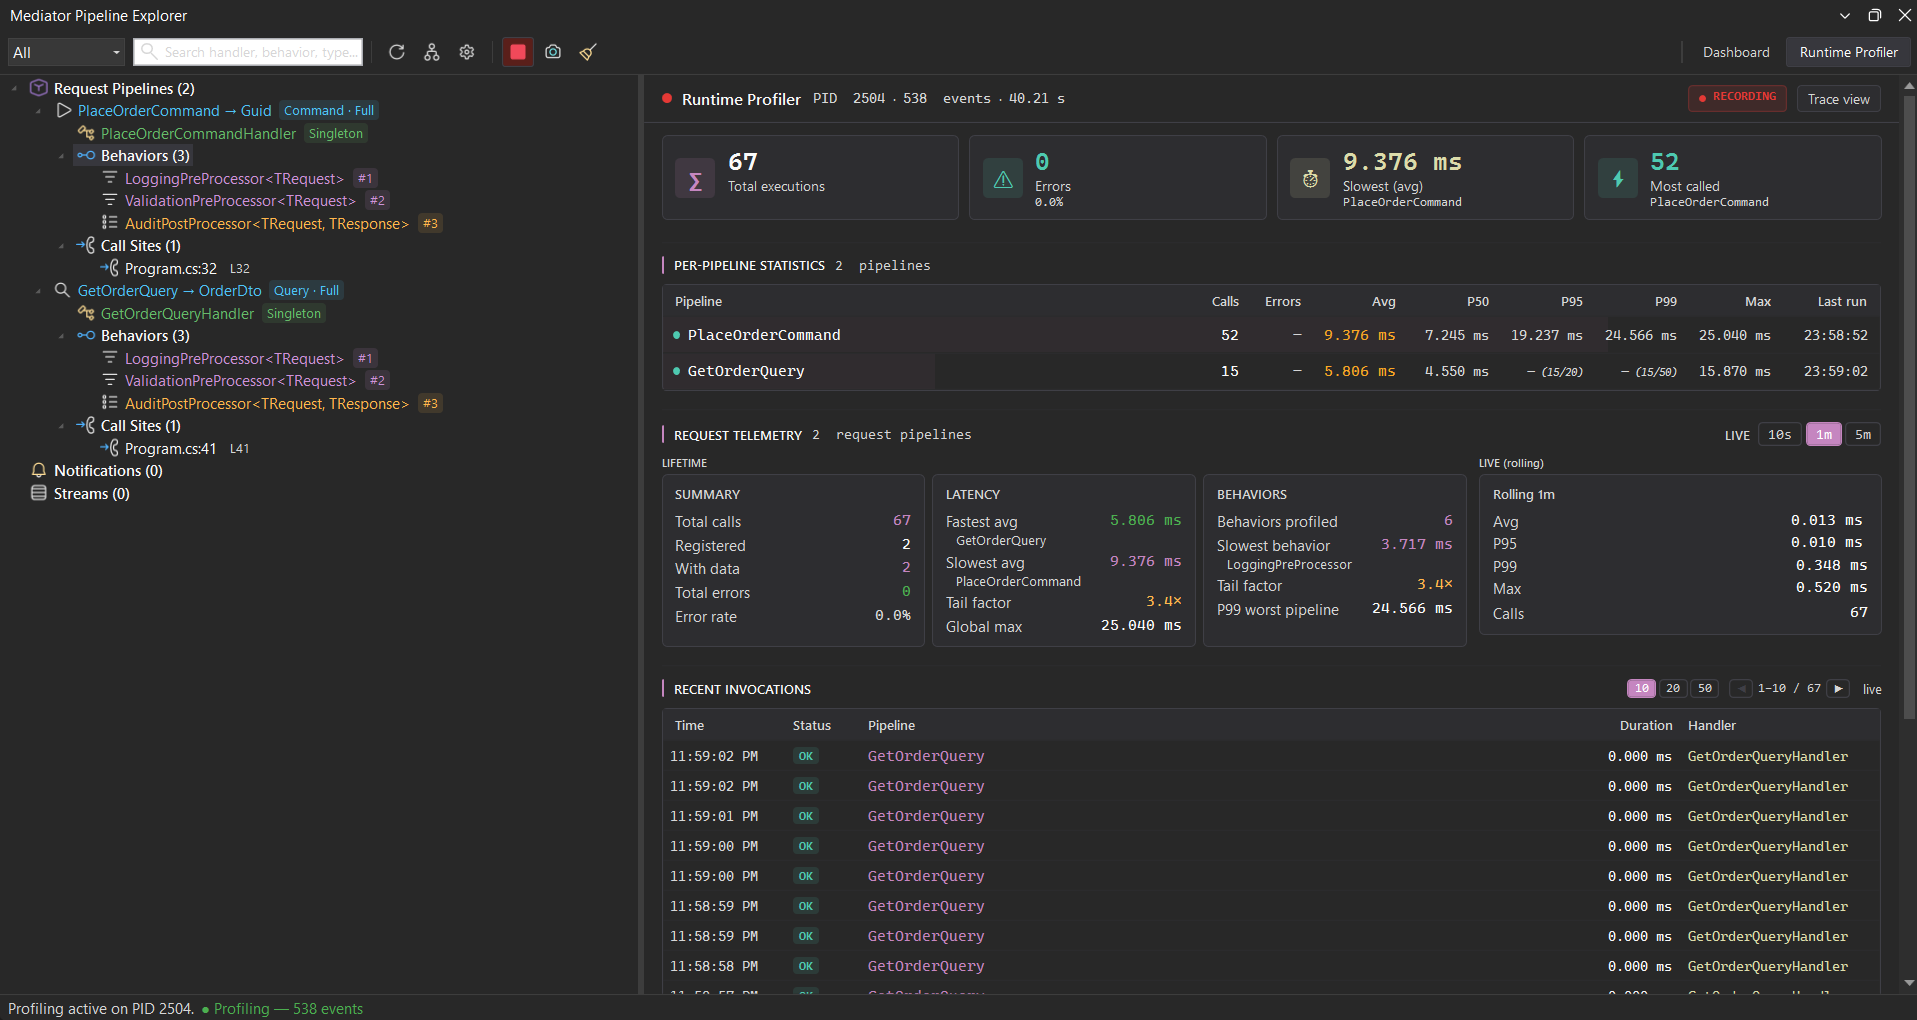
Then issue requests against your application — run an integration test, exercise an endpoint, replay traffic. Within a second or two, the Runtime Profiler fills with live timings.
Each component is timed independently. Select a pipeline’s Components node to see every component’s own runtime profile side by side — calls, average, self time, p50/p95/p99, and max — so you can tell which cross-cutting concern (validation, logging, transactions) is costing you. Tail-heavy handlers — those with a p99 far above the median — are flagged so you can spot bottlenecks instantly. The default threshold (tailHeavyMinP99Ms) prevents false positives on sub-millisecond noise.
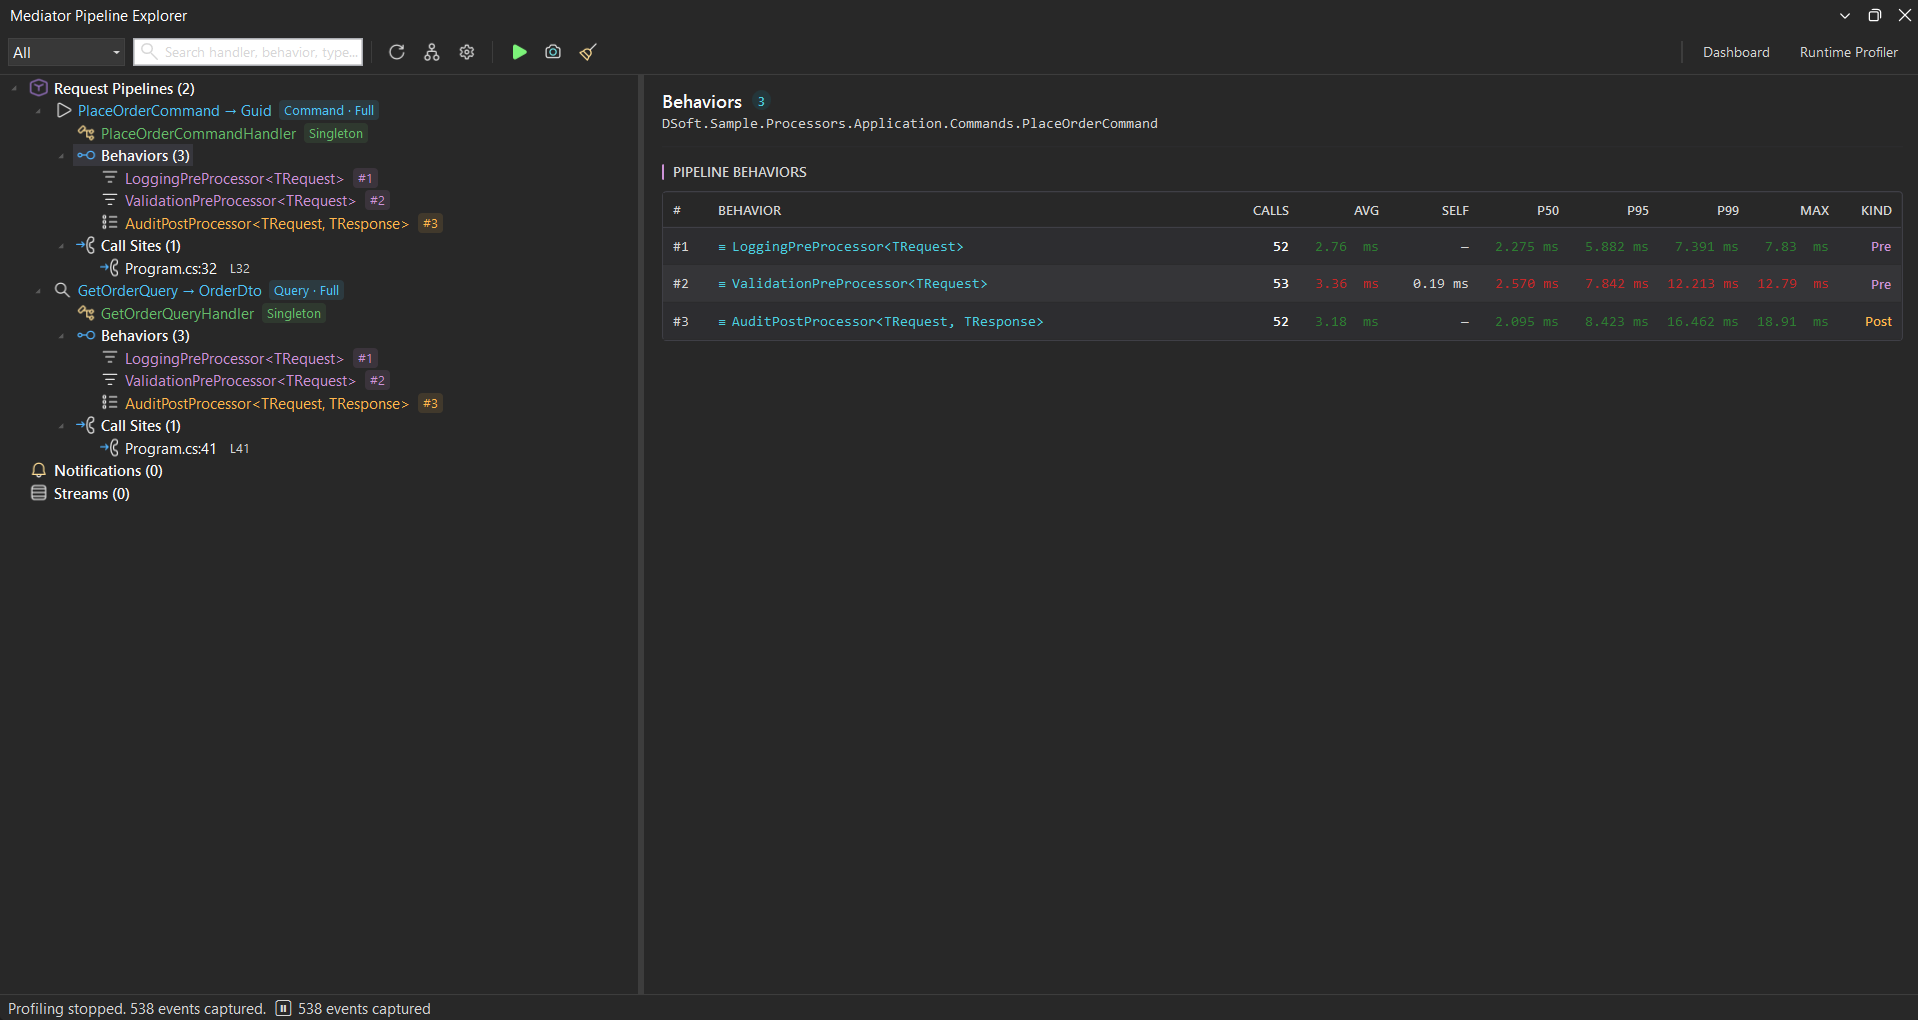
Pre / Post), so the costly cross-cutting concern stands out.Select a single component to see its type, lifetime, and source file — with one click to jump to where it’s defined.
Find the slow one
Sort the table by p99 or Avg to identify the worst offender. The Hot Path · Flame card below the invocations log shows where the time actually goes inside a slow request — handler self vs. nested handler latency vs. notification publish overhead — with a bottleneck tag on whichever step dominates.
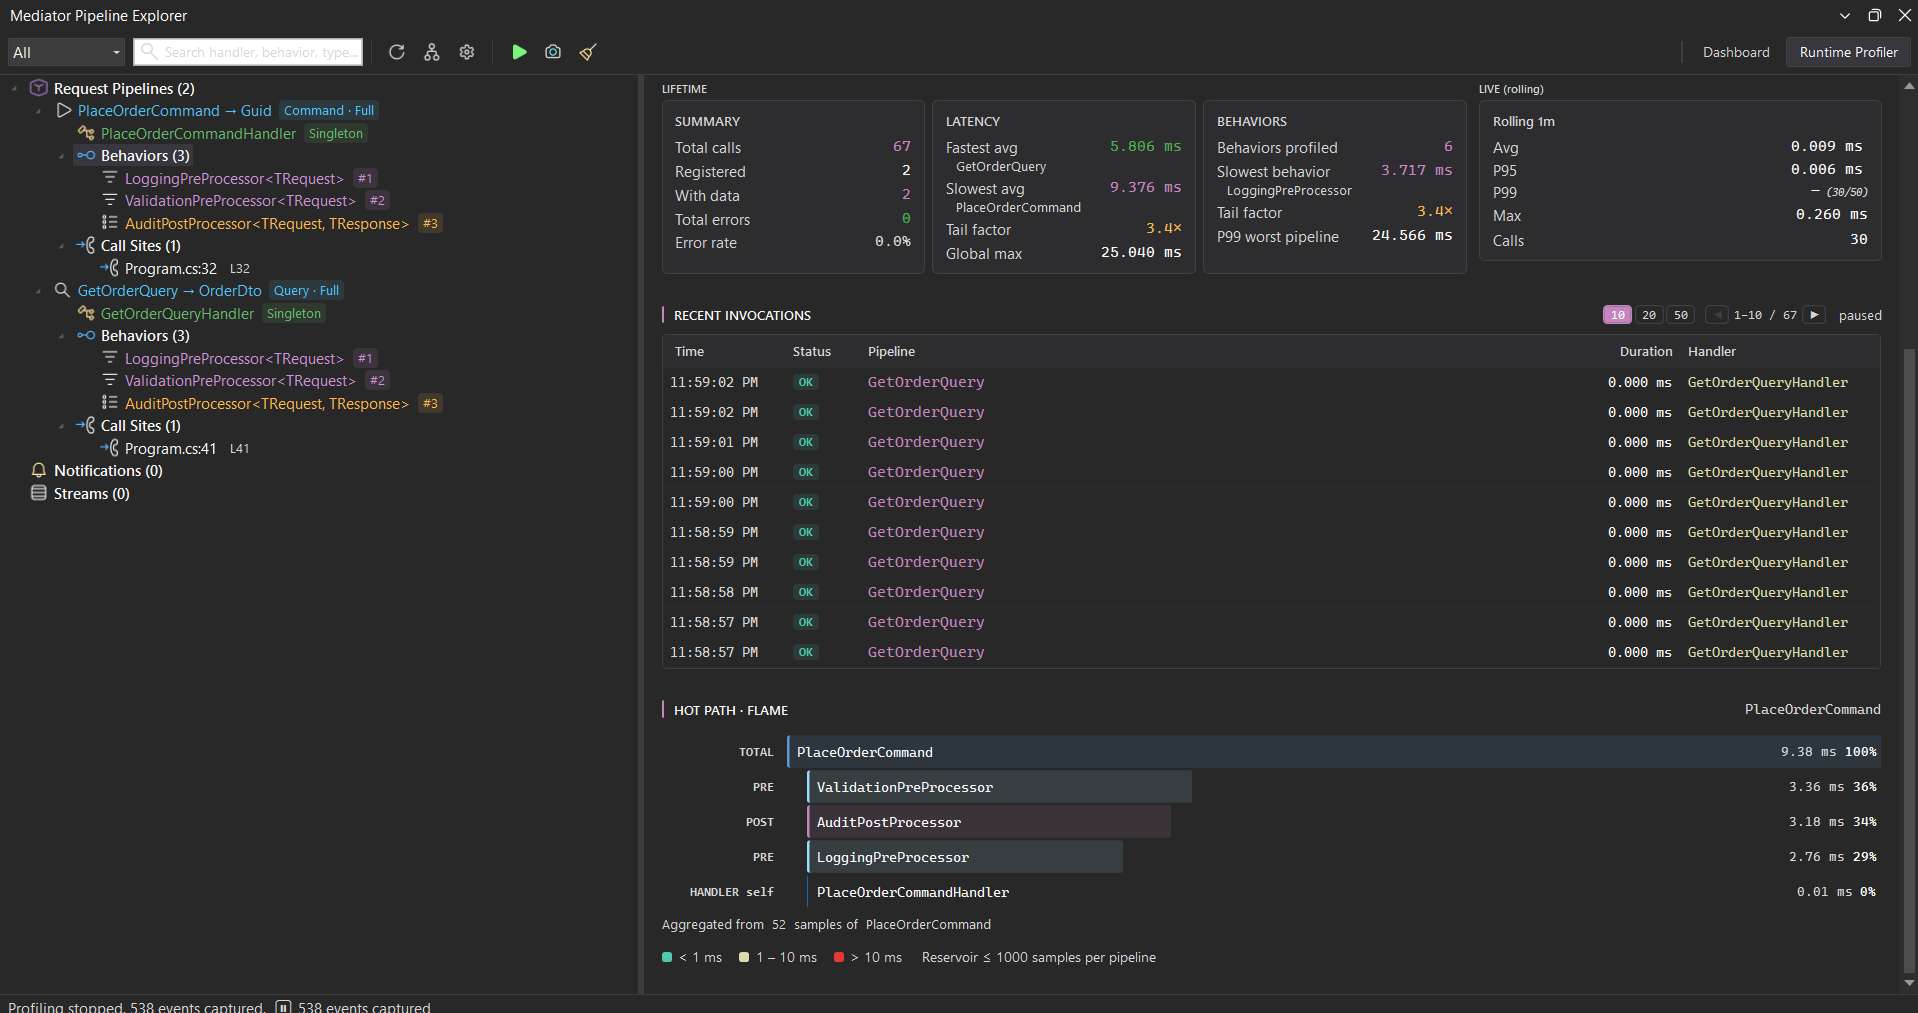
Click the bottleneck row to jump to the source. Fix it, re-run, and watch the new numbers replace the old.
When you’re done, click Stop to detach the profiler. Click Clear to reset the in-memory buffer.
5. Filter and search
As your codebase grows, the tree grows with it. Two tools keep it manageable:
- Section filter (Visual Studio only) — the dropdown at the top of the toolbar narrows the tree to one of All / Commands / Queries / Notifications / Streams. Picking Commands leaves only
ICommand<>-derived pipelines visible; Queries leaves onlyIQuery<>-derived ones. VS Code has no section-filter dropdown — narrow the tree with the search box below instead. - Search box — type any fragment of a type name, handler name, behavior name, or file path. Matches highlight and the tree collapses to the matching pipelines.
Ctrl+F (VS Code) or click the search box (VS) focuses the input. Esc clears it.
What’s next
You have everything you need to use Pipeline Explorer day-to-day. To go deeper, see:
- The troubleshooting guide — top issues and resolutions, with a diagnostic checklist.
- The runtime profiler reference (coming soon) — full p50 / p95 / p99 / max / error rate semantics.
- The settings reference (coming soon) — every toggle that controls the tree, graph, and profiler.
If something behaves unexpectedly, please file a report at the GitHub repository — every bug filed in Early Access becomes a fixed regression in the next release.