OpenTelemetry bridge → Pipeline Explorer
DSoftStudio.Mediator.OpenTelemetry instruments every mediator dispatch as an
OpenTelemetry span (a System.Diagnostics.Activity) and enriches the database spans your app already emits.
Pipeline Explorer reads those spans and renders the same Hot Path / Flame you get from the live profiler — but
now with the external dependency spans (PostgreSQL, HTTP, …) nested under the handler that made them, mapped to
your source.
There are two ways the bridge’s traces reach Pipeline Explorer:
| Mode | Status | When | What you do |
|---|---|---|---|
| Import a production trace | Available | Analyse a trace captured in prod / staging | Export an OTLP/JSON (or Jaeger/JSON) trace, then run Mediator: Import Production Trace… and pick the file |
| Live capture | Available | Profiling a local run whose solution references the bridge | Build your solution — on a successful build Pipeline Explorer refreshes and detects the bridge automatically |
Automatic vs. configured — read this first. Discovery and profiling activate automatically on a successful build. The enriched spans — the greyed dependency nodes and
db.operation.name— are not automatic and do not appear just by adding the package: they require the bridge to be wired as in Required configuration. Referencing the package is only what Pipeline Explorer detects; the enrichment itself comes from your OpenTelemetry setup.
What the bridge produces
A GET /orders that runs a query handler against PostgreSQL becomes:
GetOrdersQuery query            mediator span    (ActivitySource "DSoftStudio.Mediator")
└─ SELECT orders                db dependency    (Npgsql; enriched → db.operation.name=SELECT, db.sql.table=orders)
- Mediator spans carry
mediator.request.type,mediator.request.kind(command / query / request / stream / notification) andmediator.handler.type. That is how Pipeline Explorer maps each frame to its handler and rebuilds the dispatch tree (a command and the notification it publishes are sibling dispatches, exactly as the source expresses them). - Dependency spans come from your DB / HTTP client instrumentation and are shown as greyed nodes under the
handler that made them. The bridge’s
DatabaseSpanEnrichmentProcessorparsesdb.statementin-process intodb.operation.name/db.sql.table/db.stored_procedure.name, so each query is a distinct, readable dependency — and the raw statement never leaves the app (see Security & redaction).
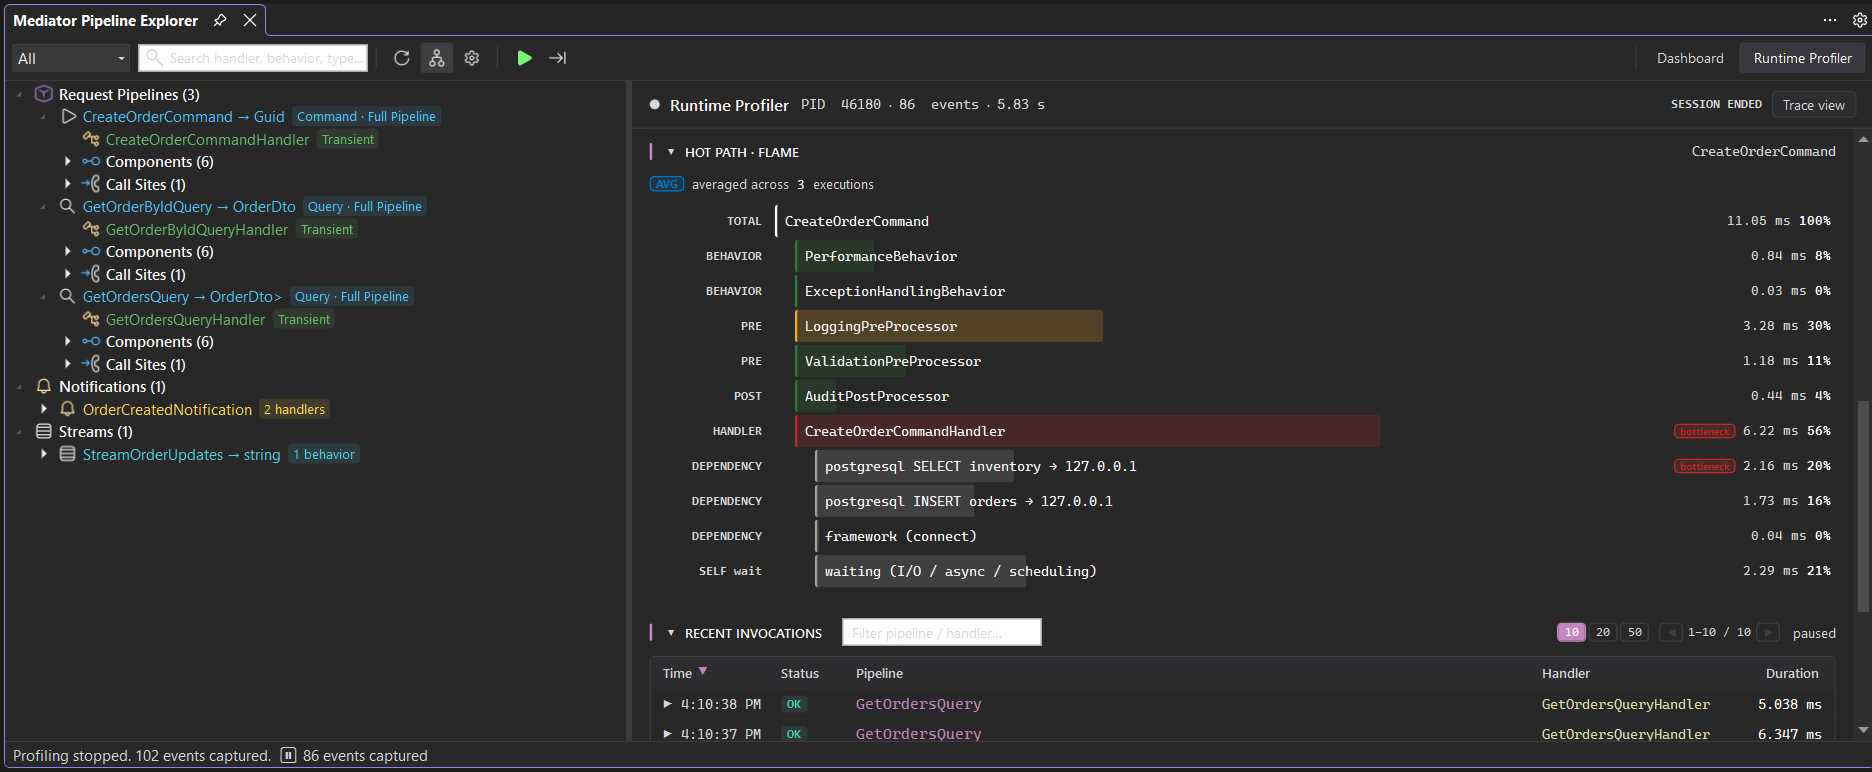
postgresql SELECT inventory, INSERT orders, the connection) and a SELF wait row under the handler that made them, each with its share of the total and a bottleneck marker on the slowest.Required configuration
To get the enriched flame (dependency spans with operation names), wire the bridge on both the service
collection and the tracer provider. These are different extension methods that share a name — a standard
OpenTelemetry .NET convention, the same way AddAspNetCoreInstrumentation exists on both builders:
// 1) Produce the mediator spans — registers the tracing / metrics pipeline behaviors.
builder.Services.AddMediatorInstrumentation();

// 2) Listen to + enrich them — adds the mediator ActivitySource and the DB enrichment processor.
builder.Services.AddOpenTelemetry().WithTracing(tracing => tracing
    .AddMediatorInstrumentation()       // AddSource("DSoftStudio.Mediator") + DatabaseSpanEnrichmentProcessor
    .AddSource("Npgsql")                // your DB client's spans (or AddNpgsql())
    .AddHttpClientInstrumentation());   // outbound HTTP dependency spans
| Call | Receiver | Without it |
|---|---|---|
AddMediatorInstrumentation() |
IServiceCollection |
the mediator spans are never created |
AddMediatorInstrumentation() |
TracerProviderBuilder |
the mediator spans aren’t listened to, and db.operation.name is never derived (no enrichment) |
AddSource("Npgsql") · AddHttpClientInstrumentation() |
TracerProviderBuilder |
the DB / HTTP dependency spans don’t appear |
An OTLP exporter is optional. The bridge creates spans whenever any listener is attached — Pipeline Explorer’s live capture is itself a listener — so you do not need an OTLP collector for live profiling.
Mode A — Import a production trace
- In your app’s OpenTelemetry setup, add an OTLP/JSON file exporter (or export to Jaeger and Download JSON for a trace).
- In the IDE run Mediator: Import Production Trace… and pick the file.
- Pipeline Explorer parses the spans, maps the mediator frames to source, nests the dependency spans, and renders
the Hot Path / Flame — averaged across every dispatch in the trace, with a
×Nchip on repeated dependencies (N+1 detection).
This is the way to bring real production behaviour — the actual DB calls, the real fan-out, the genuine tail — into the IDE for analysis, without attaching a profiler to anything.
Mode B — Live capture
Pipeline Explorer refreshes automatically after a successful build (with mediator.autoRefresh on — the
default): it re-discovers the solution, and that re-discovery is where it sees whether your projects reference the
bridge.
When a discovered solution references DSoftStudio.Mediator.OpenTelemetry, the live profiler captures the
bridge’s enriched spans directly from the running process — over the same EventPipe channel it already uses, with no
OTLP collector and no file export — giving the dependency spans and db.operation.name live, exactly as in an
imported trace.
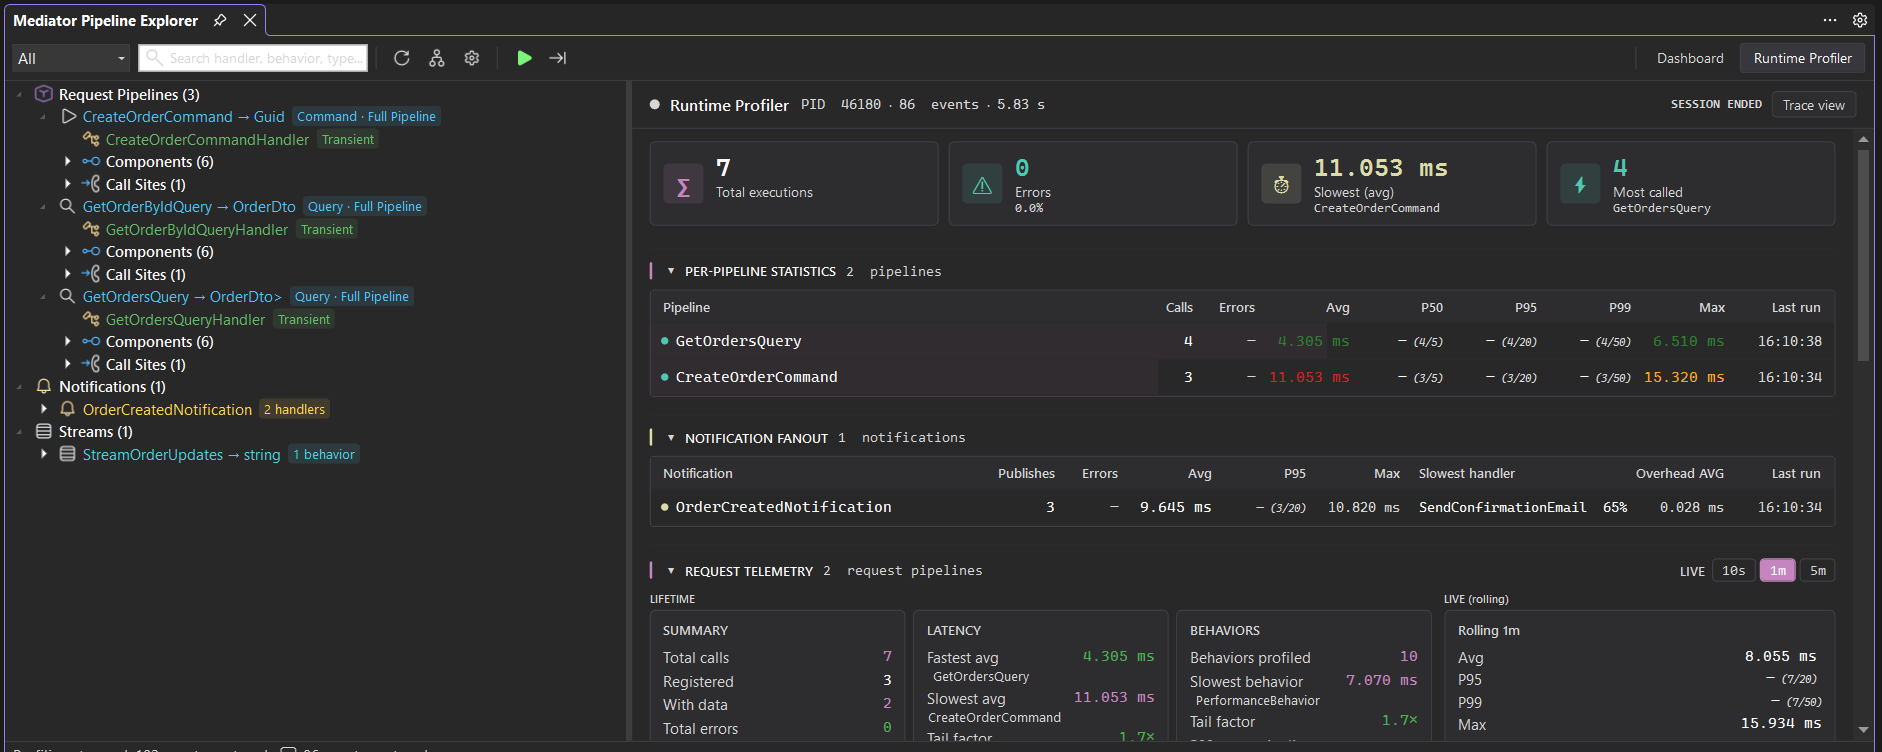
OrderCreatedNotification → 2 handlers) and streams, all captured over EventPipe with no OTLP collector running.When the solution does not reference the bridge, the profiler stays on its built-in instrumentation events (handlers + behaviors, without external dependency spans), and Mode A remains the way to get the full picture.
Enrichment requirement:
db.operation.nameonly appears when the tracer-providerAddMediatorInstrumentation()(the enrichment processor) is present — see Required configuration. Referencing the package alone surfaces the mediator and raw dependency spans, but not the derived operation name.
Security & redaction
The bridge is designed so that no raw SQL or URL ever leaves your process:
DatabaseSpanEnrichmentProcessorruns in-process and derives only the operation name, table, and stored-procedure name fromdb.statement. Pipeline Explorer reads those derived attributes — it never readsdb.statementitself.- Dependency labels are built from an allow-list of vetted attributes (peer host, operation, method) — never arbitrary tags, query strings, exception messages, or payloads.
That is what makes a production trace safe to open in a developer’s IDE.
See also
- OpenTelemetry integration — full bridge setup: traces, metrics, logs, exporters.
- Pipeline Explorer — the discovery tree, graph, and runtime profiler.